I’ve said many times that prairie and wetland restoration work has been some of the most gratifying of my career. The opportunity to literally build new prairie from the ground up is pretty tough to beat. Perhaps the only thing better is the chance to watch that new prairie become a mature, dynamic community of plants that supports a broad diversity of animals as well.
I’ll apologize up front that this post might be a little too ‘inside baseball’ for some readers. I’m going to share a lot of details about a restoration project that I think are fascinating. I’m hoping at least a few others will enjoy it, but I won’t be offended (and I won’t know anyway) if some of you skim this pretty quickly and move on. The last three paragraphs summarize the story pretty well if you want to skip ahead.
Last summer, a couple of my favorite restored prairies hit their 20th growing seasons. One of them, the Derr West 2002 Restoration, has been particularly interesting to watch for several reasons. First, it was planted with the most diverse seed mix we’ve ever created – a total of 218 plant species (all locally-harvested). Second, when we started grazing the site, we built a permanent exclosure in one corner that has given us some ability to compare fire only management with fire/grazing management. Finally, and related to the first two, I’ve been collecting intensive plant community data at the site every season since the site’s 3rd growing season in 2004.
Site Description, Management, and Evaluation Methods
The 68 acre former cropfield includes 6,000 linear feet of slough wetlands we created by excavating shallow channels that have standing water when groundwater is high. Spoil from those excavations were used to create curvilinear (there’s a word!) sand ridges. Those wetlands and ridges were planted with tailored seed mixes and the remainder of the site was planted with a mix of mesic plant species that included some of the wet and sandy species too. Seed was broadcast in February, 2002 with an EZ-Flow fertilizer spreader that dropped the seed onto soil that had been disked after corn was harvested the previous fall.
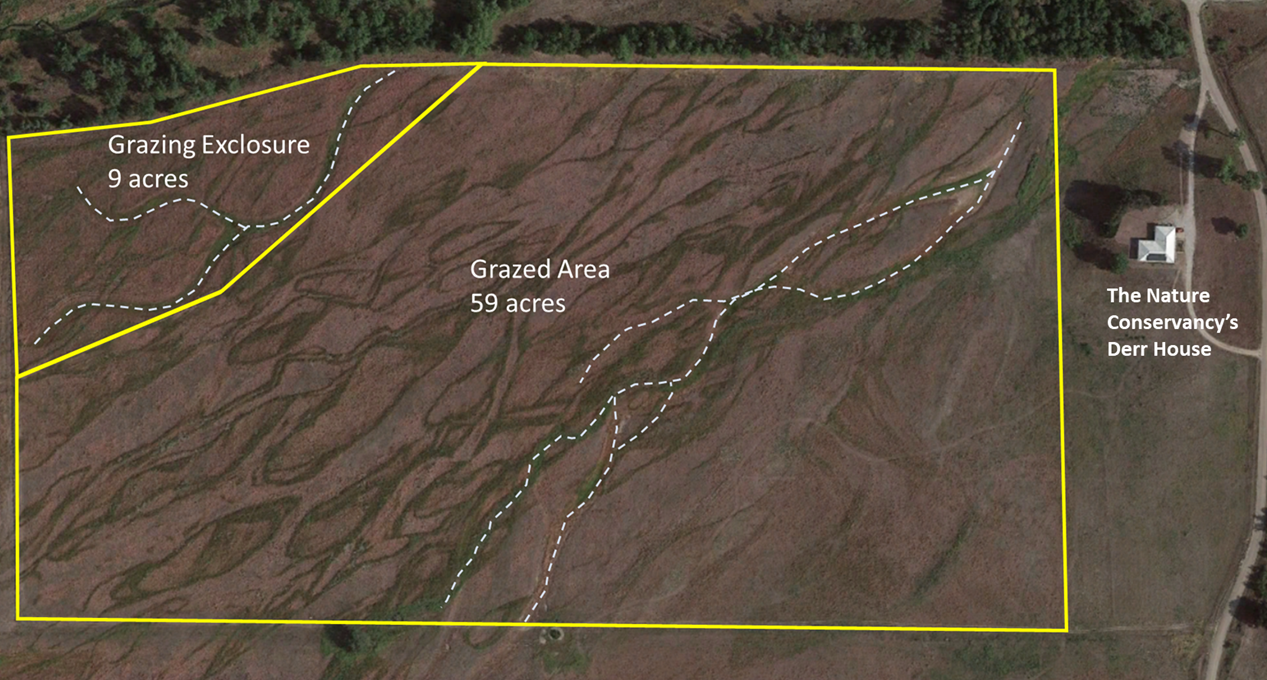
Starting in 2009, we combined this restored prairie with adjacent prairies to make a 370 acre management unit and began a modified patch-burn grazing approach that included a year of complete rest from grazing every once in a while. Within that large management, units were burned (usually either early or late spring) and then intensively grazed for a full growing season. At any one time, there were patches being grazed hard and others that were in the midst of a multiple year recovery period from the last grazing treatment. The exception was a 9 acre grazing exclosure we built at the northwest corner of this restored prairie, which got burned at about the same frequency as the rest of the site (average = 3-4 year frequency), but never grazed.
It’s been fascinating to watch the site mature and evolve. In addition to frequent wandering around the site, I also collected annual data on plant composition. Dating back to 2004, I’ve stomped through the prairie every year with a 1×1 meter plot frame, plopping it down about 70 times in the grazed area and 25-30 times in the ungrazed exclosure (random stratified design – not permanent plots). Each time I laid the frame down, I listed all the plant species I could see within it.
Results
Between 2004 and 2021, I’ve found a cumulative total of 175 different plant species within those plots. I only sample from the mesic portions of the site, (skipping the wetlands and sand ridges) so I feel like 175 species is pretty good. There are probably a few I’ve missed because they aren’t common enough to have show up within those little plots yet (the sum total of all those plots is about 1/5 acre, so I’m sampling a very small portion of the total each year). I also haven’t crosschecked against the initial planting list to see what we planted that isn’t yet on that list, but there can’t be too many absences.
For those of you who might want to dig into the full details of the following results, here’s a link to a PDF so you can peruse at will. For the rest of you, here are a few highlights:

Floristic quality is a metric that combines species richness (# of species) with a rating of how tolerant a species is to degraded conditions. Species found mainly in non-degraded sites get higher values. I averaged the floristic quality of all the 1×1 subplots I sampled from each year to get a mean floristic quality number. If you look at the above graph, mean floristic quality grew during the late establishment phase of the site. You can also see a brief dip in 2013, a year after a severe drought in 2012. Apart from that, there has been little change over time, which I take as a sign of ecological resilience.

The next two graphs show the same time period depicted in the first graph, but include comparisons between the data from the grazed portion of the site and the ungrazed exclosure. The first graph shows mean floristic quality again and the second graph shows mean species richness, which is simply the average number of plant species found within those 1x1m plots each year.

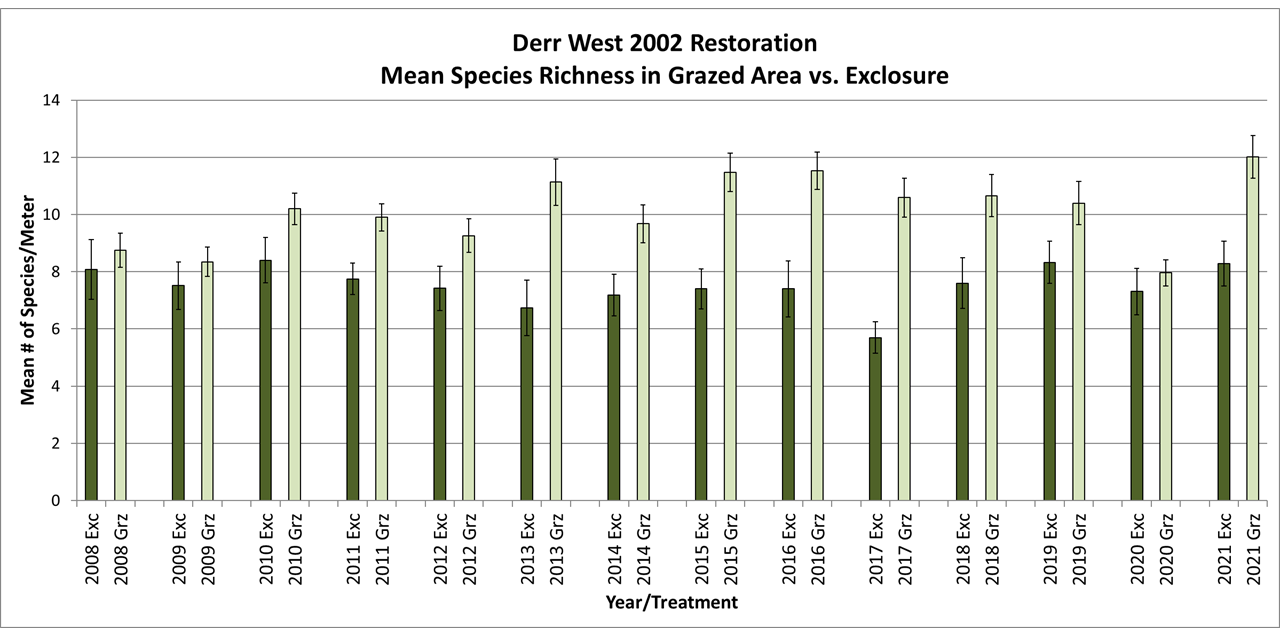
My interpretation of the above graphs is that the seeded plant community has been remarkably resilient over time. Through fire, drought, floods, and grazing (in the grazed area), the community has maintained its diversity. Grazing doesn’t seem to have had a negative impact on floristic quality and has had a positive impact on species richness (number of species per plot) in most years. Some of that higher species richness is due to ‘weedy’ species that benefit from periodically weakened grass dominance, but as the graphs below show, there’s more to the story.
It’s interesting how obvious the effects of the 2012 drought are. Mean floristic quality dropped in both the grazed and ungrazed areas in 2013 but recovered within a year or two. Mean species richness in 2013 dropped in the exclosure (but not in a statistically significant way) but rose strongly in the grazed portion of the site, likely because a broad suite of plants took advantage of lower competition from species stressed by the drought. Both floristic quality and species richness leveled back off quickly, however. Again, I feel like this is positive evidence that this constructed community is able to adapt and withstand stressors.
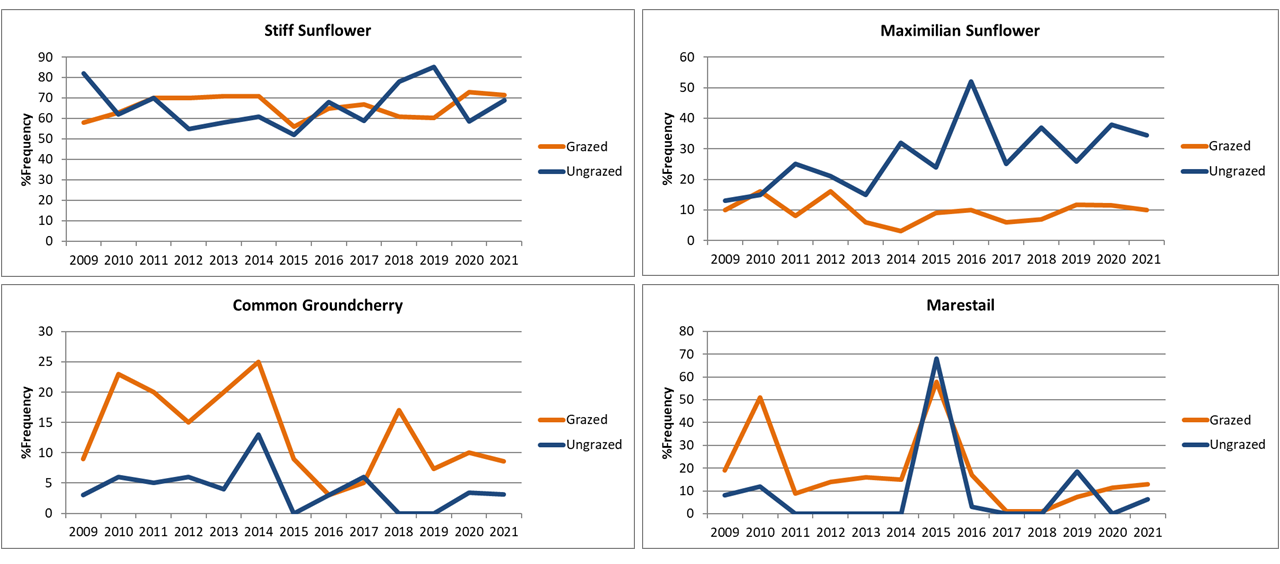
The following graphs show example species and their individual changes in frequency of occurrence through time. Frequency of occurrence is the % of 1×1 plots the species was found within each year. The orange lines show species occurrence frequency in the grazed area and the dark blue represents the same for the ungrazed exclosure. I find it fascinating to see the differing patterns. I can make informed guesses about the reasons for some of them, but others just raise fun questions that would be fun to explore.
As you look at the graphs, remember that there’s just a single exclosure, it is considerably smaller than the grazed area (9 acres compared to 59 acres) and includes less variation in soil conditions. In addition, there are fewer than half as many samples from the exclosure as from the grazed area. As a result, be cautious in interpreting too much. This isn’t a replicated study, it’s just a comparison to help interpret what’s going on and to trigger questions to follow up on. I focus mostly on the initial difference between occurrence frequency within grazed vs. ungrazed areas in 2009 and whether that difference grew or shrank over time.


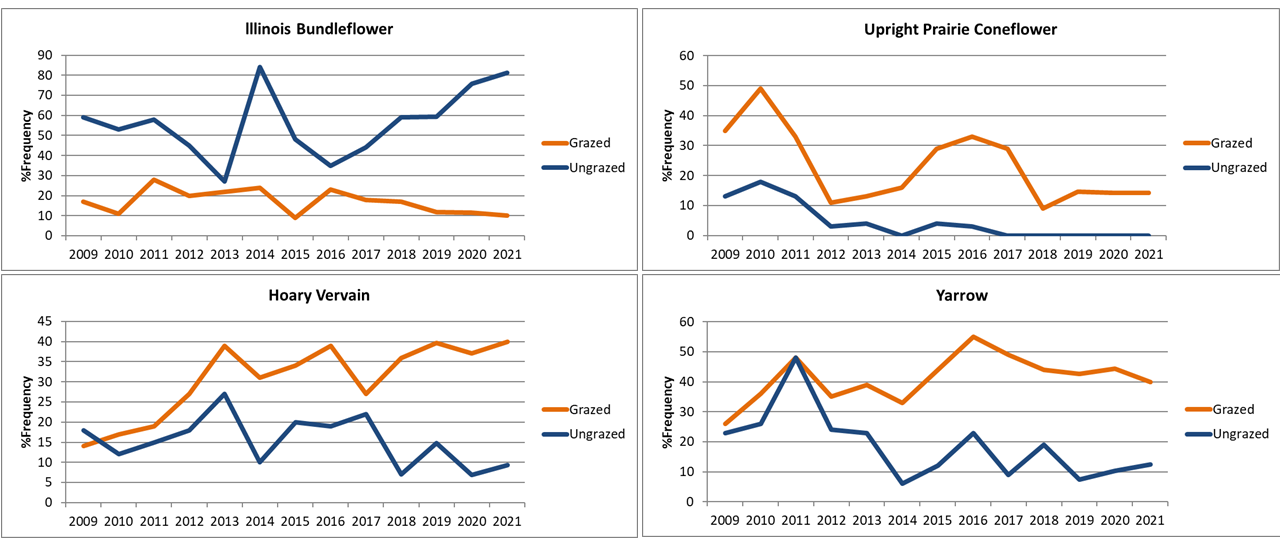
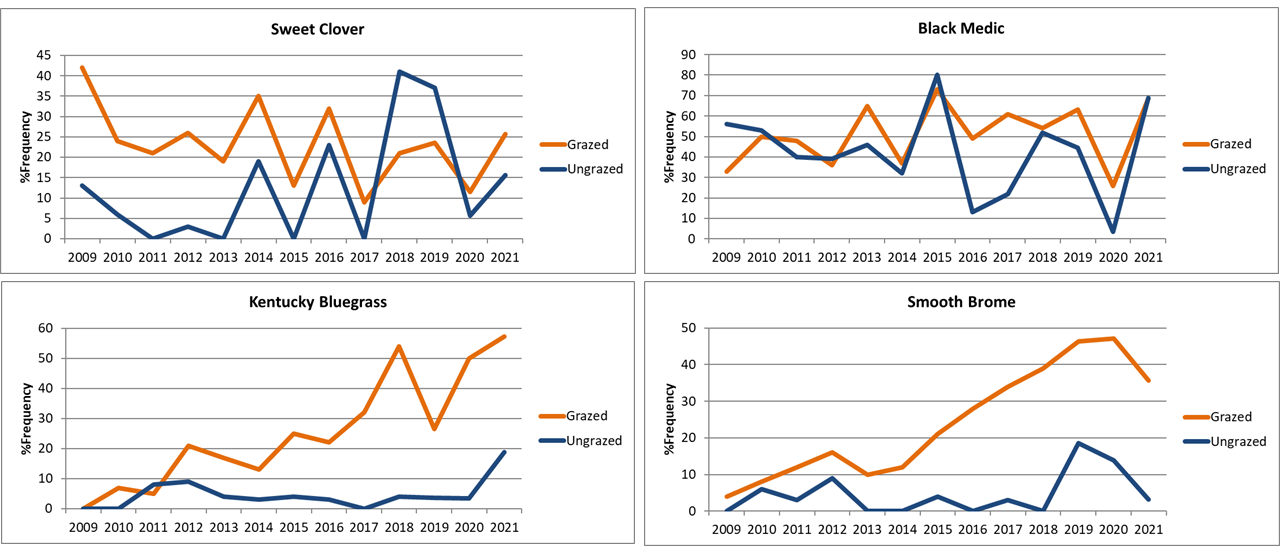
I’m really encouraged by the apparent resilience of this site over time. Most species vary in abundance from year to year, but I don’t know of any that have disappeared altogether. The plant communities within the exclosure and grazed areas have become different from each other over time, but neither is necessarily better. The exclosure is less diverse and more grass-dominated, but also has higher abundances of some forb species that seem to thrive better in the absence of grazing (but are surviving in the grazed area as well).
Most importantly to me, the grazed area, which definitely has more heterogeneous habitat (other data not shown here) doesn’t seem to be showing signs of degradation due to the grazing management we use to manage it. Mean floristic quality remains stable and we’re not seeing local extinctions of any plant species. We’re creating a wider range of habitat while still maintaining a diverse plant community.
However, our restoration objective is not just to create a diverse prairie plant community in what used to be crop land. The primary objective is to use that restoration project to enlarge and reconnect neighboring prairies. A diverse plant community contributes toward that, but it’s also important that the new habitat acts as ‘connective tissue’ and provides places for animal species to feed, live, and travel.
We’ve collected data on bees, ants, small mammals, and grasshoppers/katydids that indicate we’re doing well on the habitat front, in addition to maintaining plant diversity. If we can create habitat that helps defragment the landscape, manage it for a diversity of animals, and maintain plant diversity over long periods of time, that’s pretty sweet. We still have a lot to learn, and our oldest sites are still less than 30 years old, so a lot might happen that will make us reconsider, but so far so good!