It’s getting hard to find any wildflowers still in bloom. Insect diversity is way down. We had our first frost last week. I think it’s about time to say goodbye to the 2026 growing season.
That doesn’t mean prairies are finished showing off, though. I was in Kentucky and Tennessee most of last week for the Eastern Native Grasslands Symposium (great conference – thank you for inviting and inspiring me!) but I’ve still managed several recent trips out into local prairies. I’ve seen plenty of beauty during each prairie visit. The most recent of those visits was this morning when I helped Mike Schrad check his small mammal traps (we caught just one plains pocket mouse) at the Platte River Prairies.
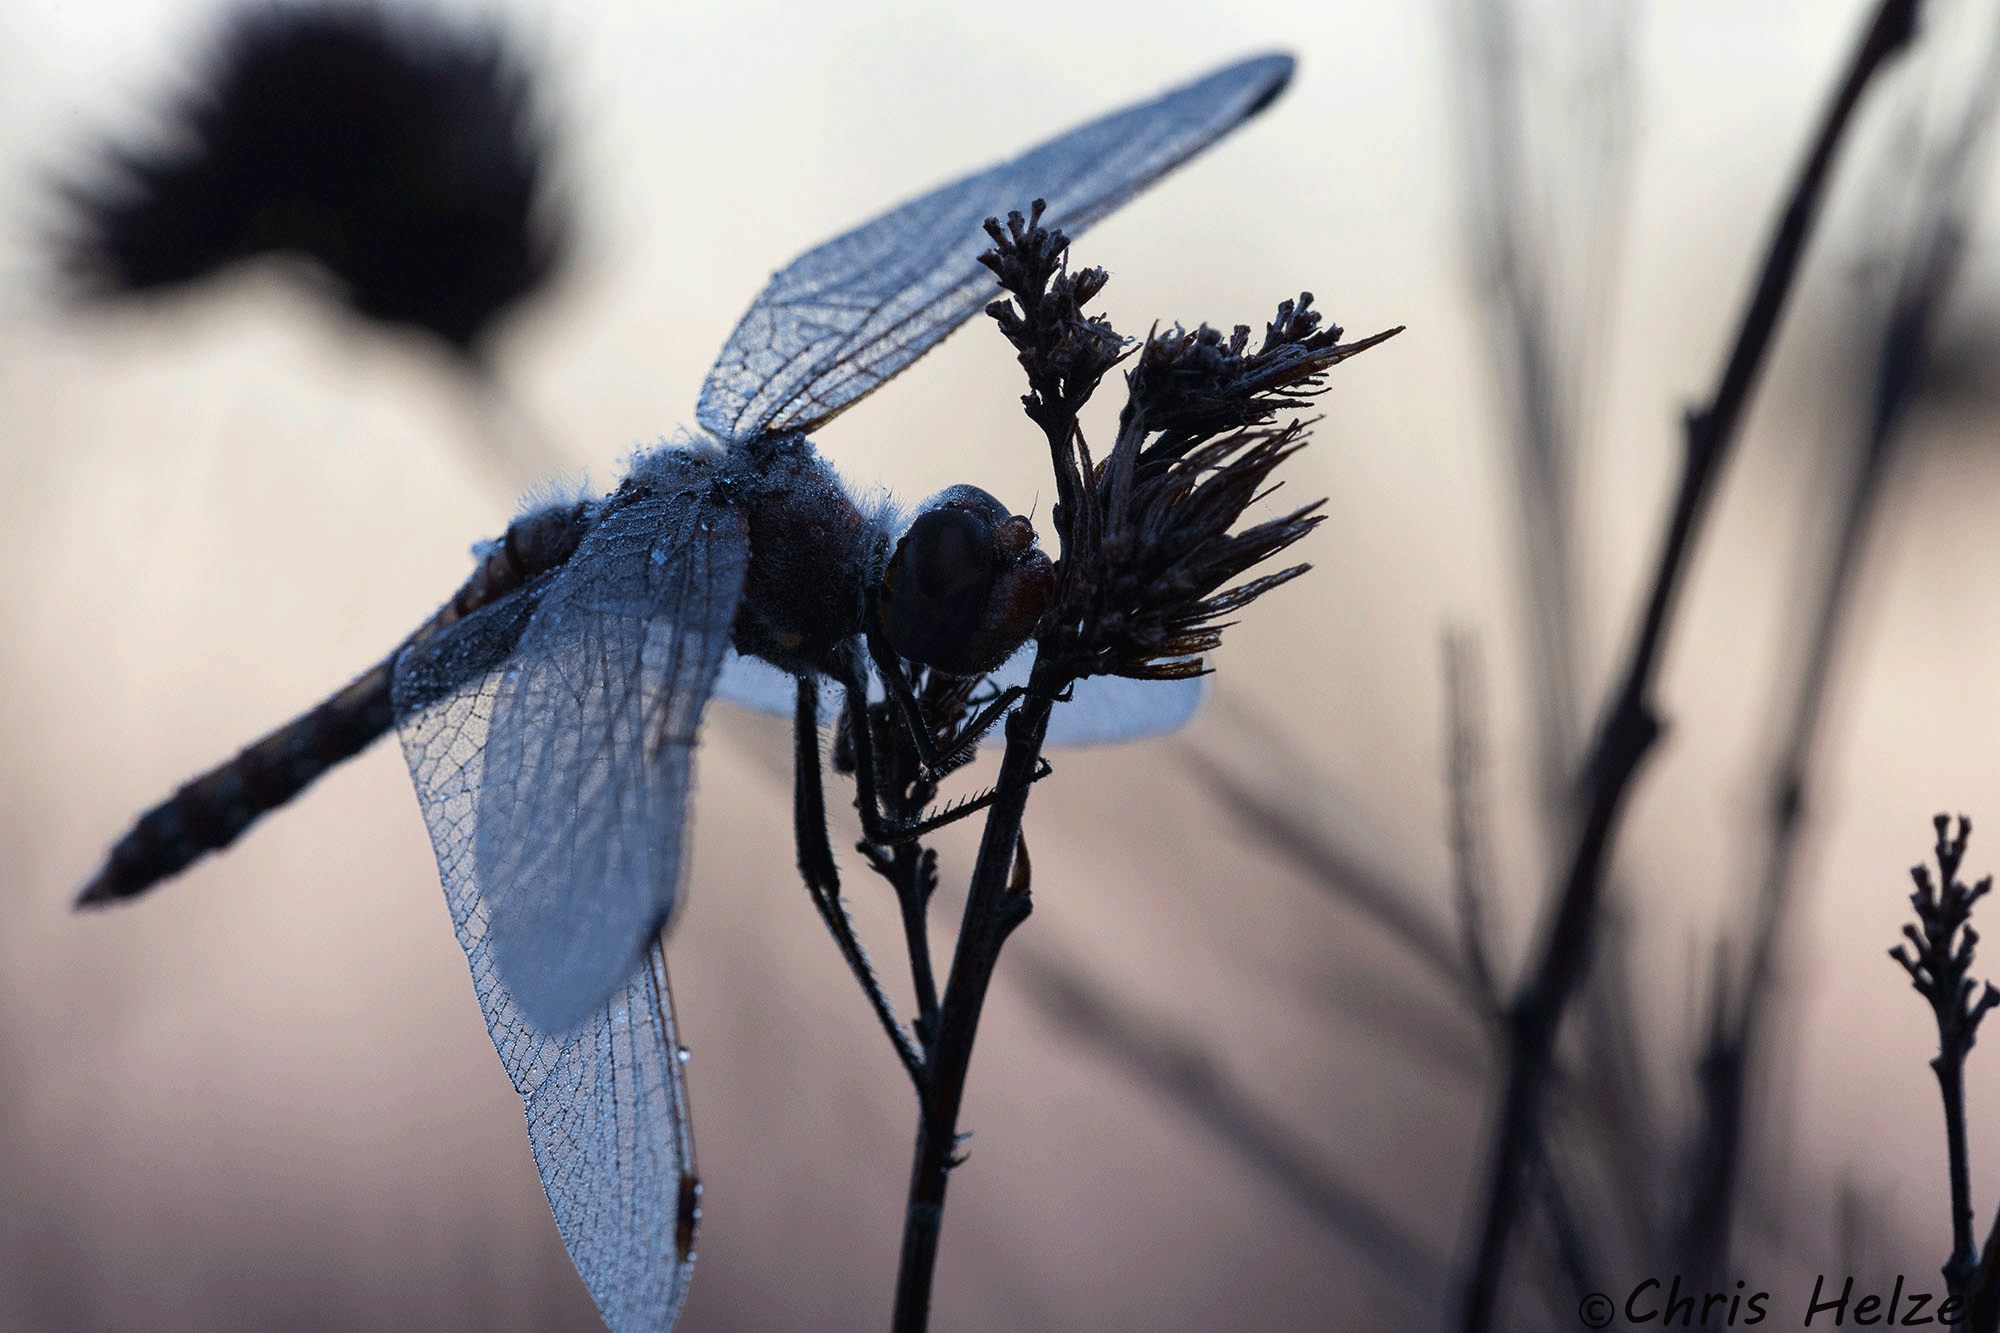
I arrived early this morning and found a variegated meadowhawk on its overnight roost. The sun wasn’t up yet and there was a thin layer of fog across the prairie. I got low to the ground and managed a few photos of the dragonfly before Mike arrived and it was time to get to work. Surprisingly, this was my first photo of a meadowhawk during this fall migration. I normally run across quite a few of them in late September and October as they’re moving southward through Nebraska, but I’ve just not been in the right places at the right times until today, apparently.
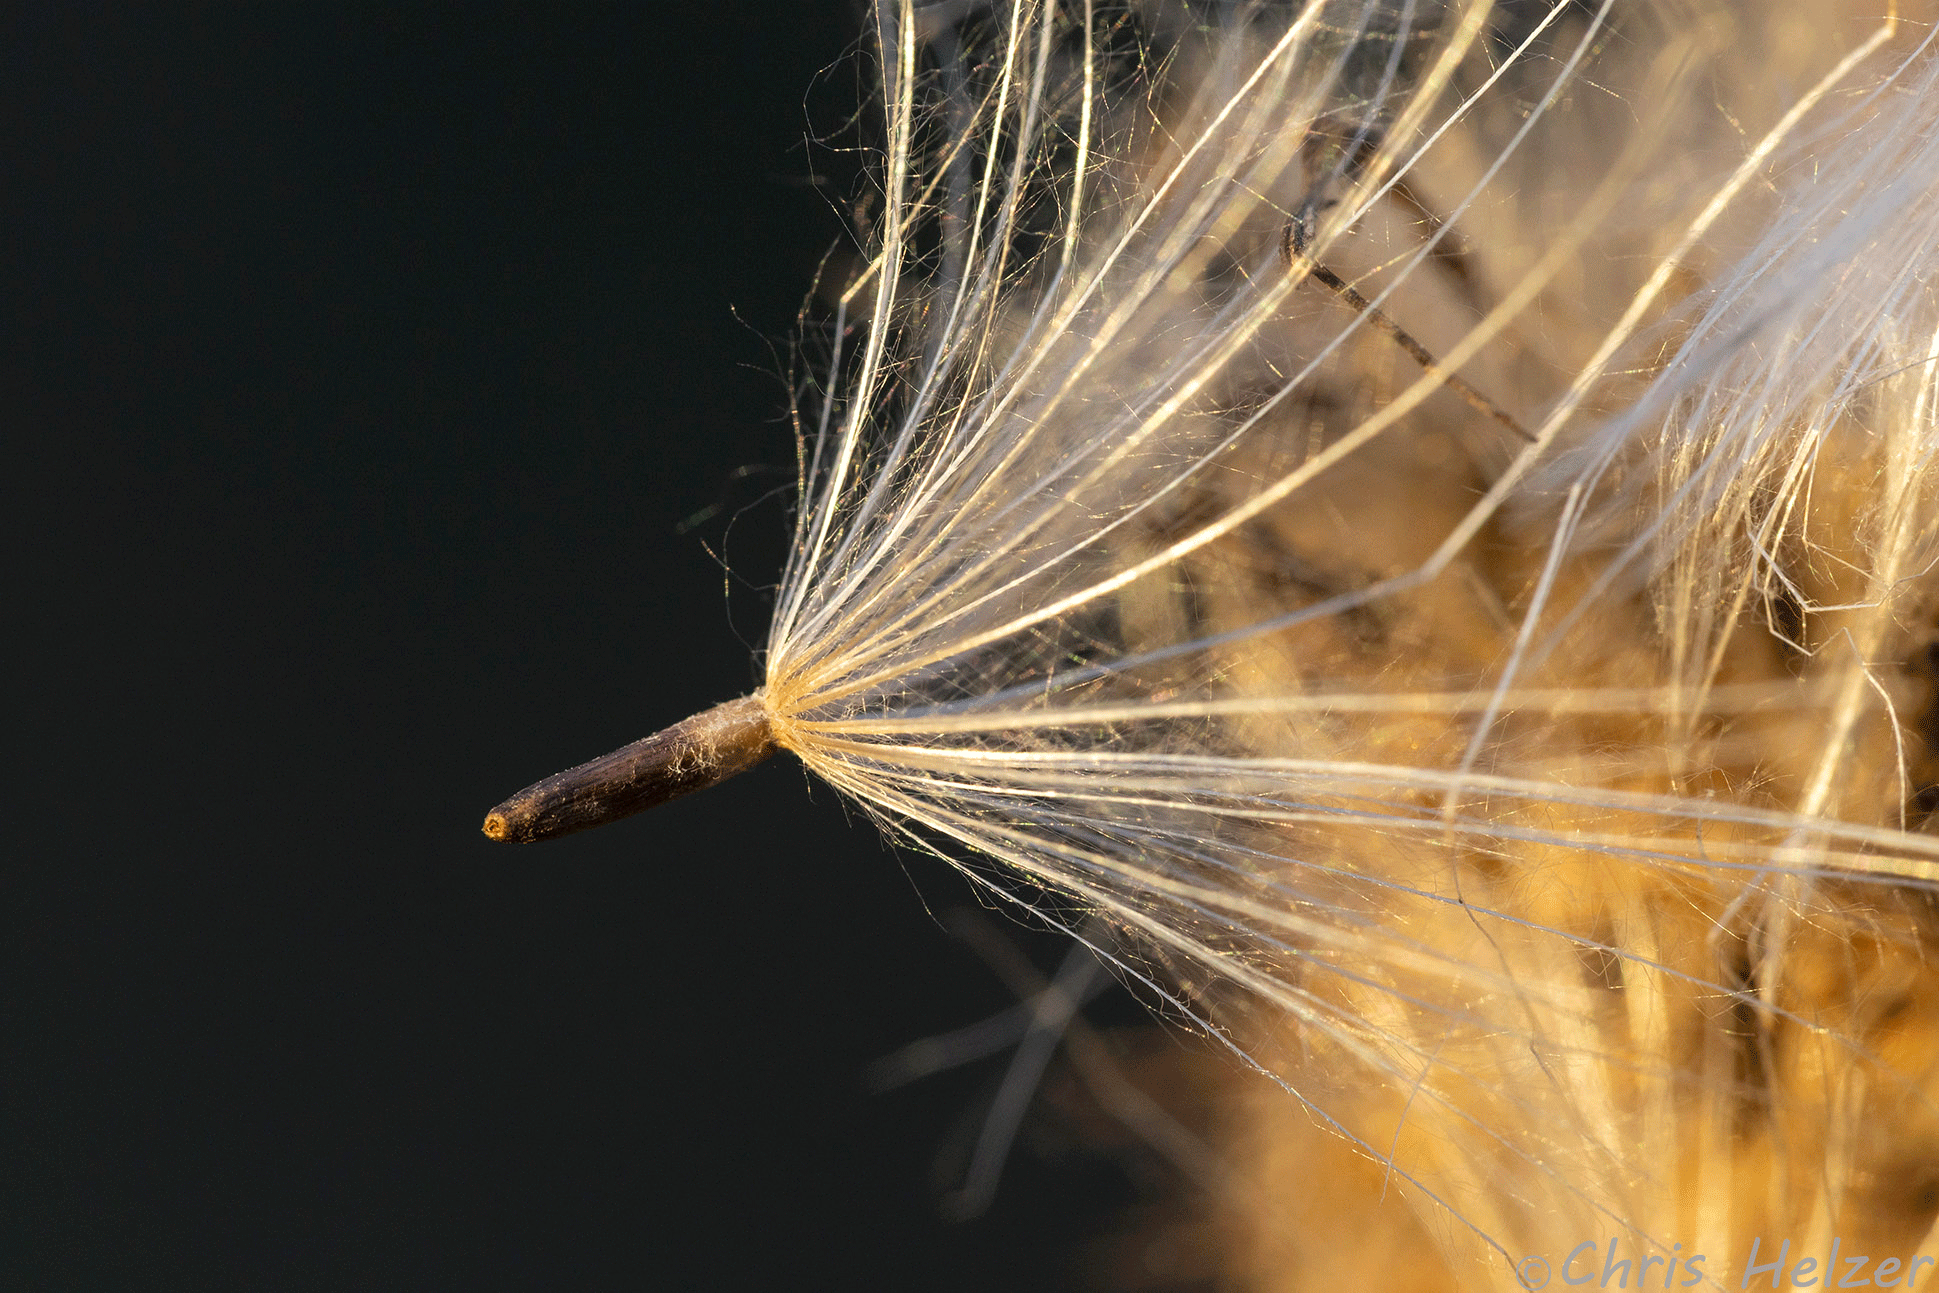
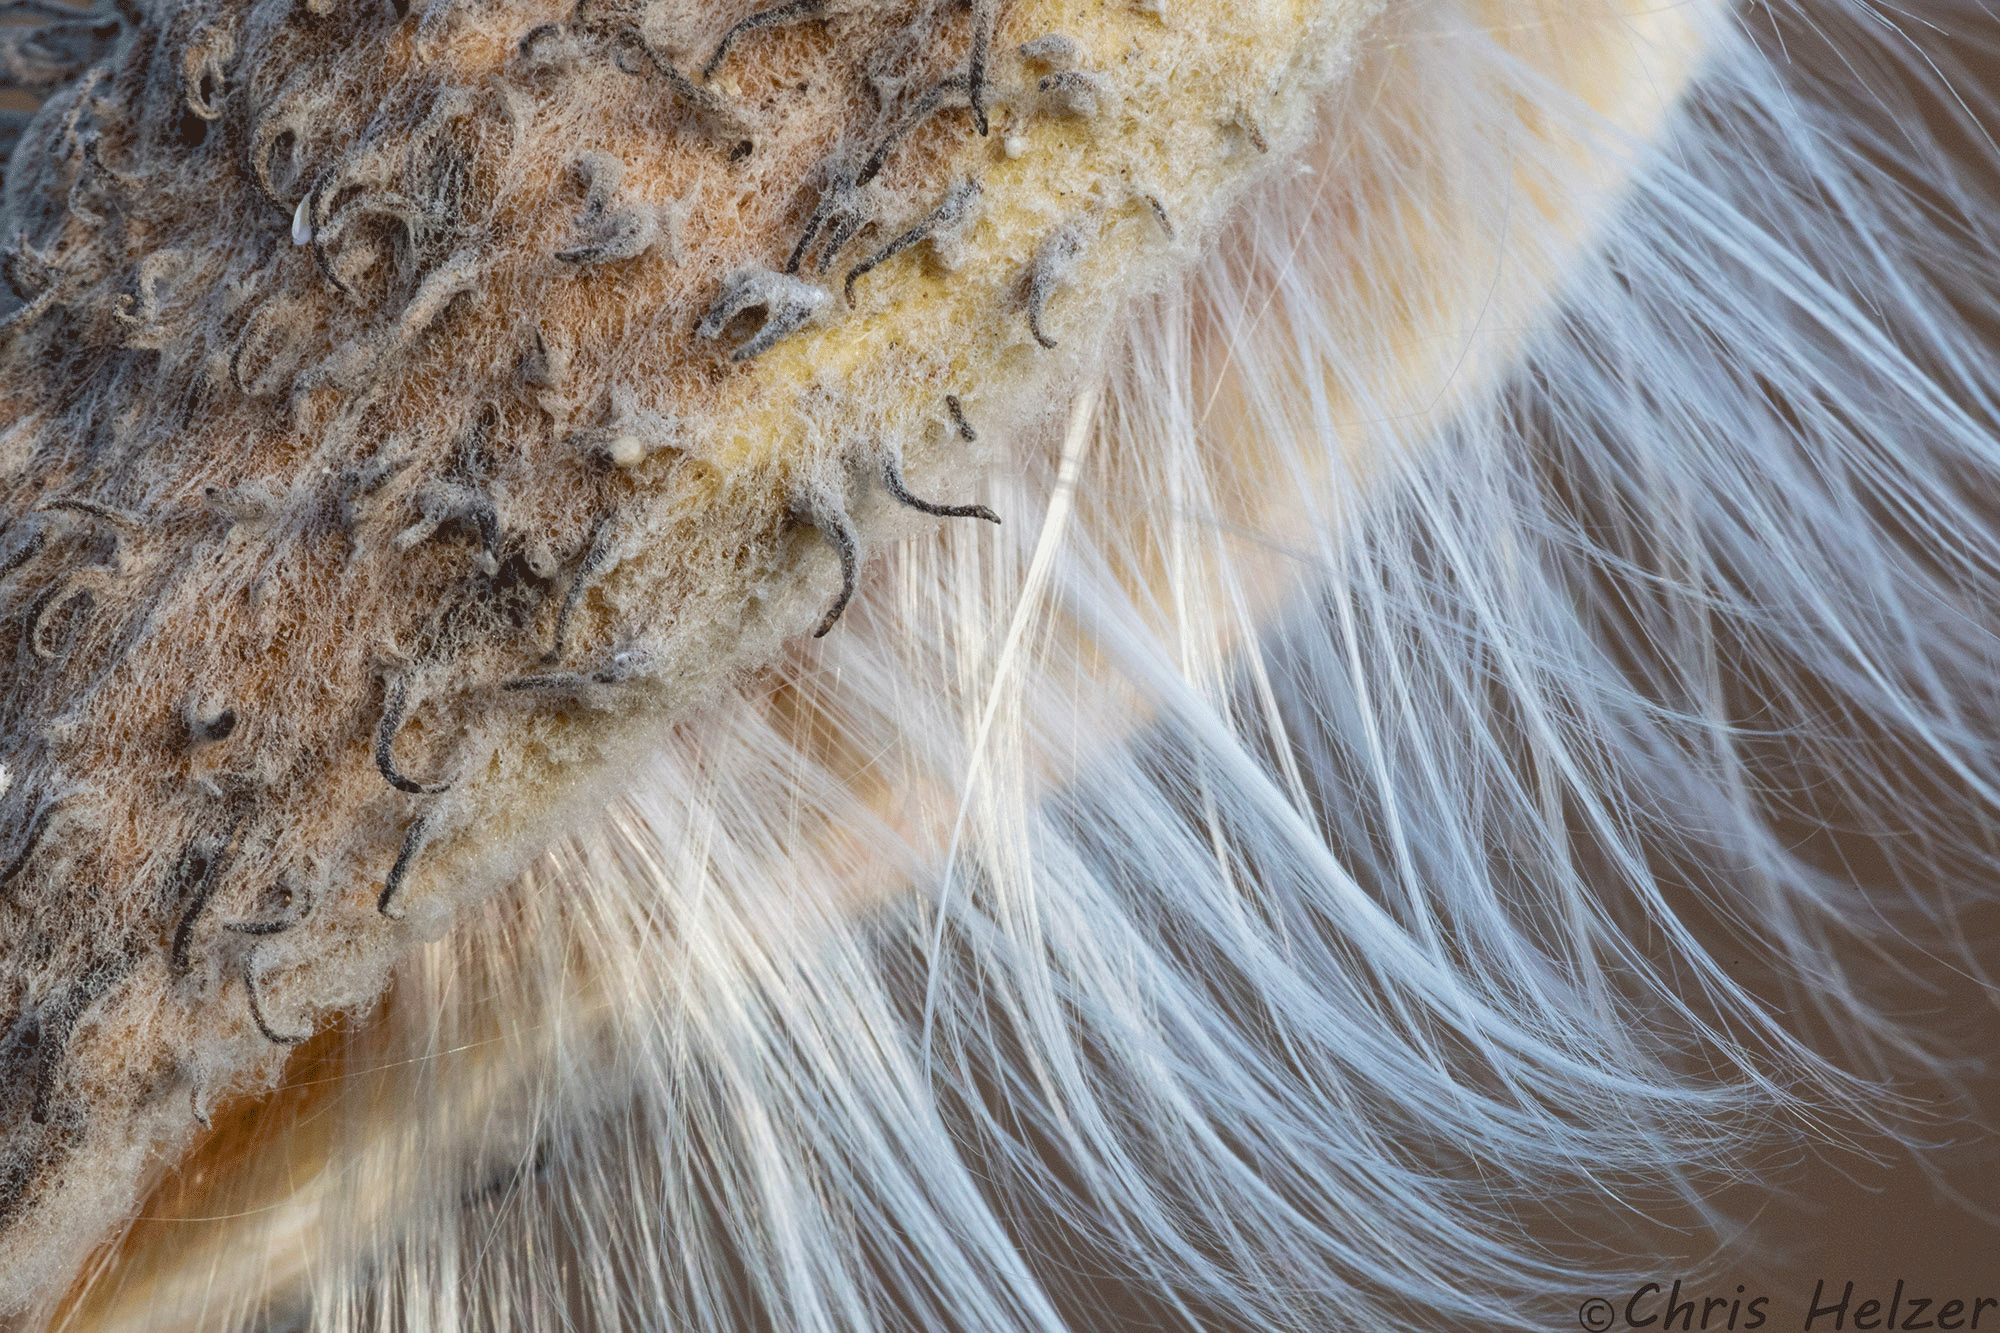
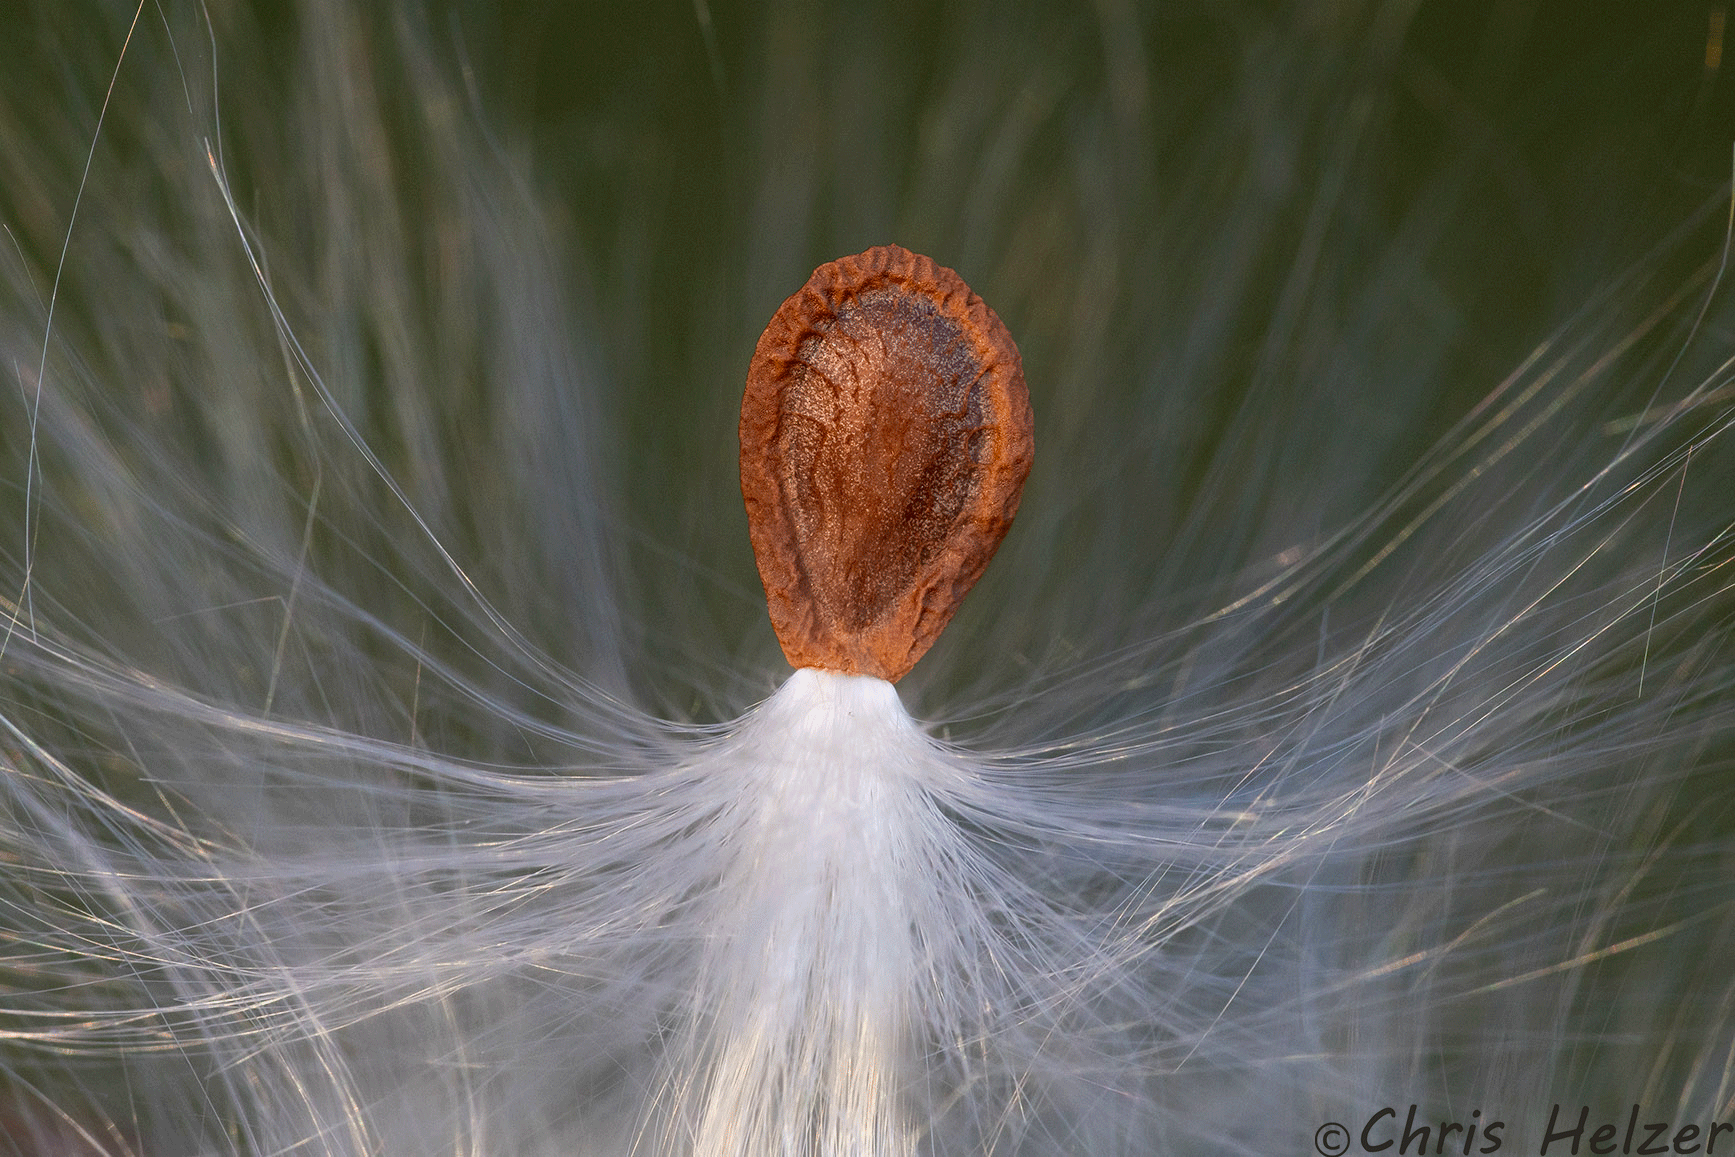
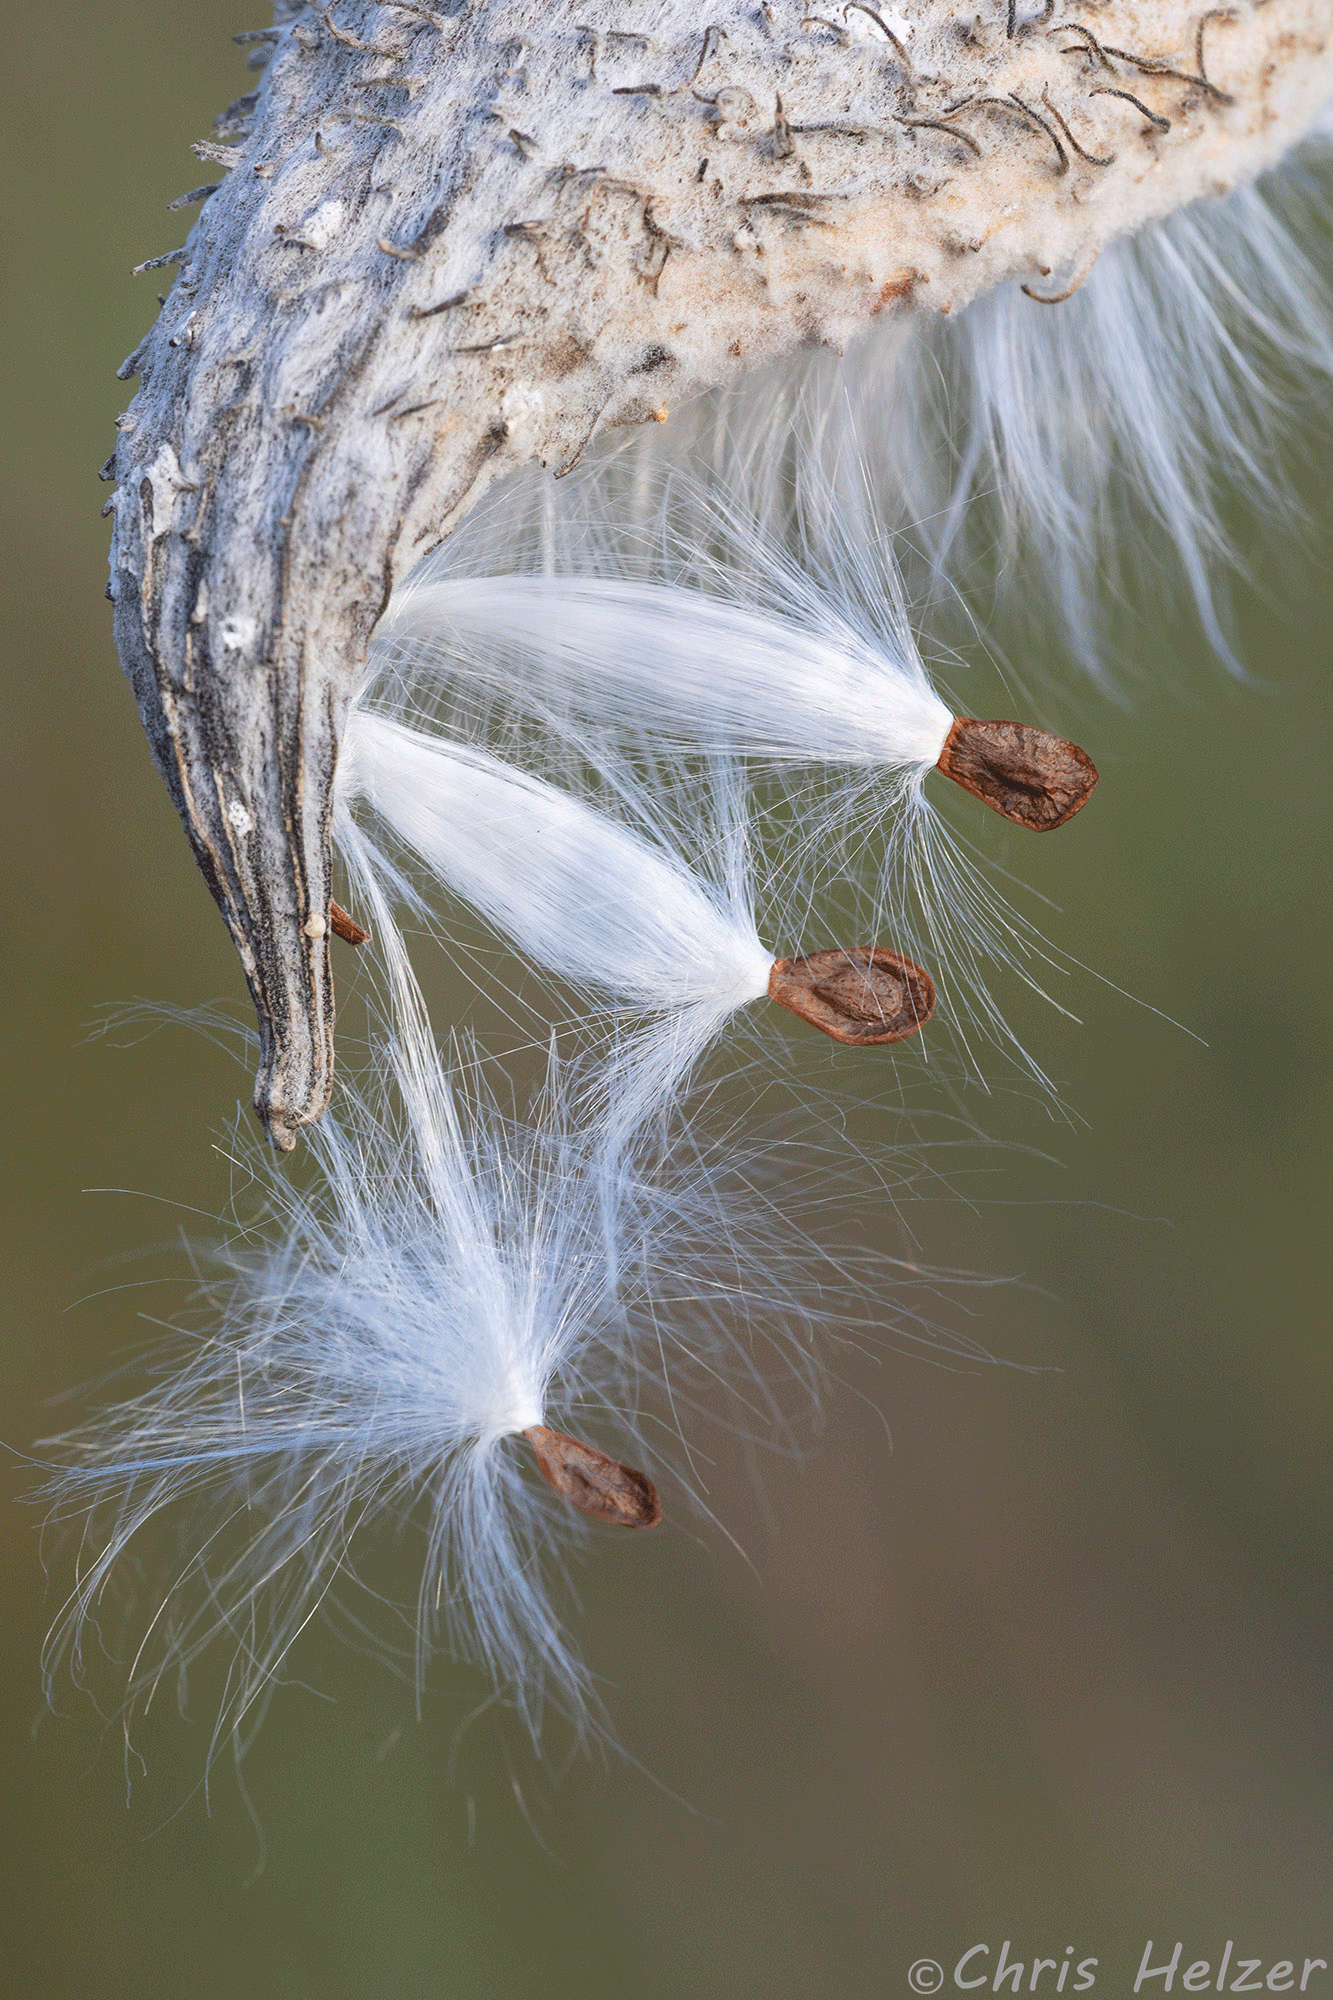
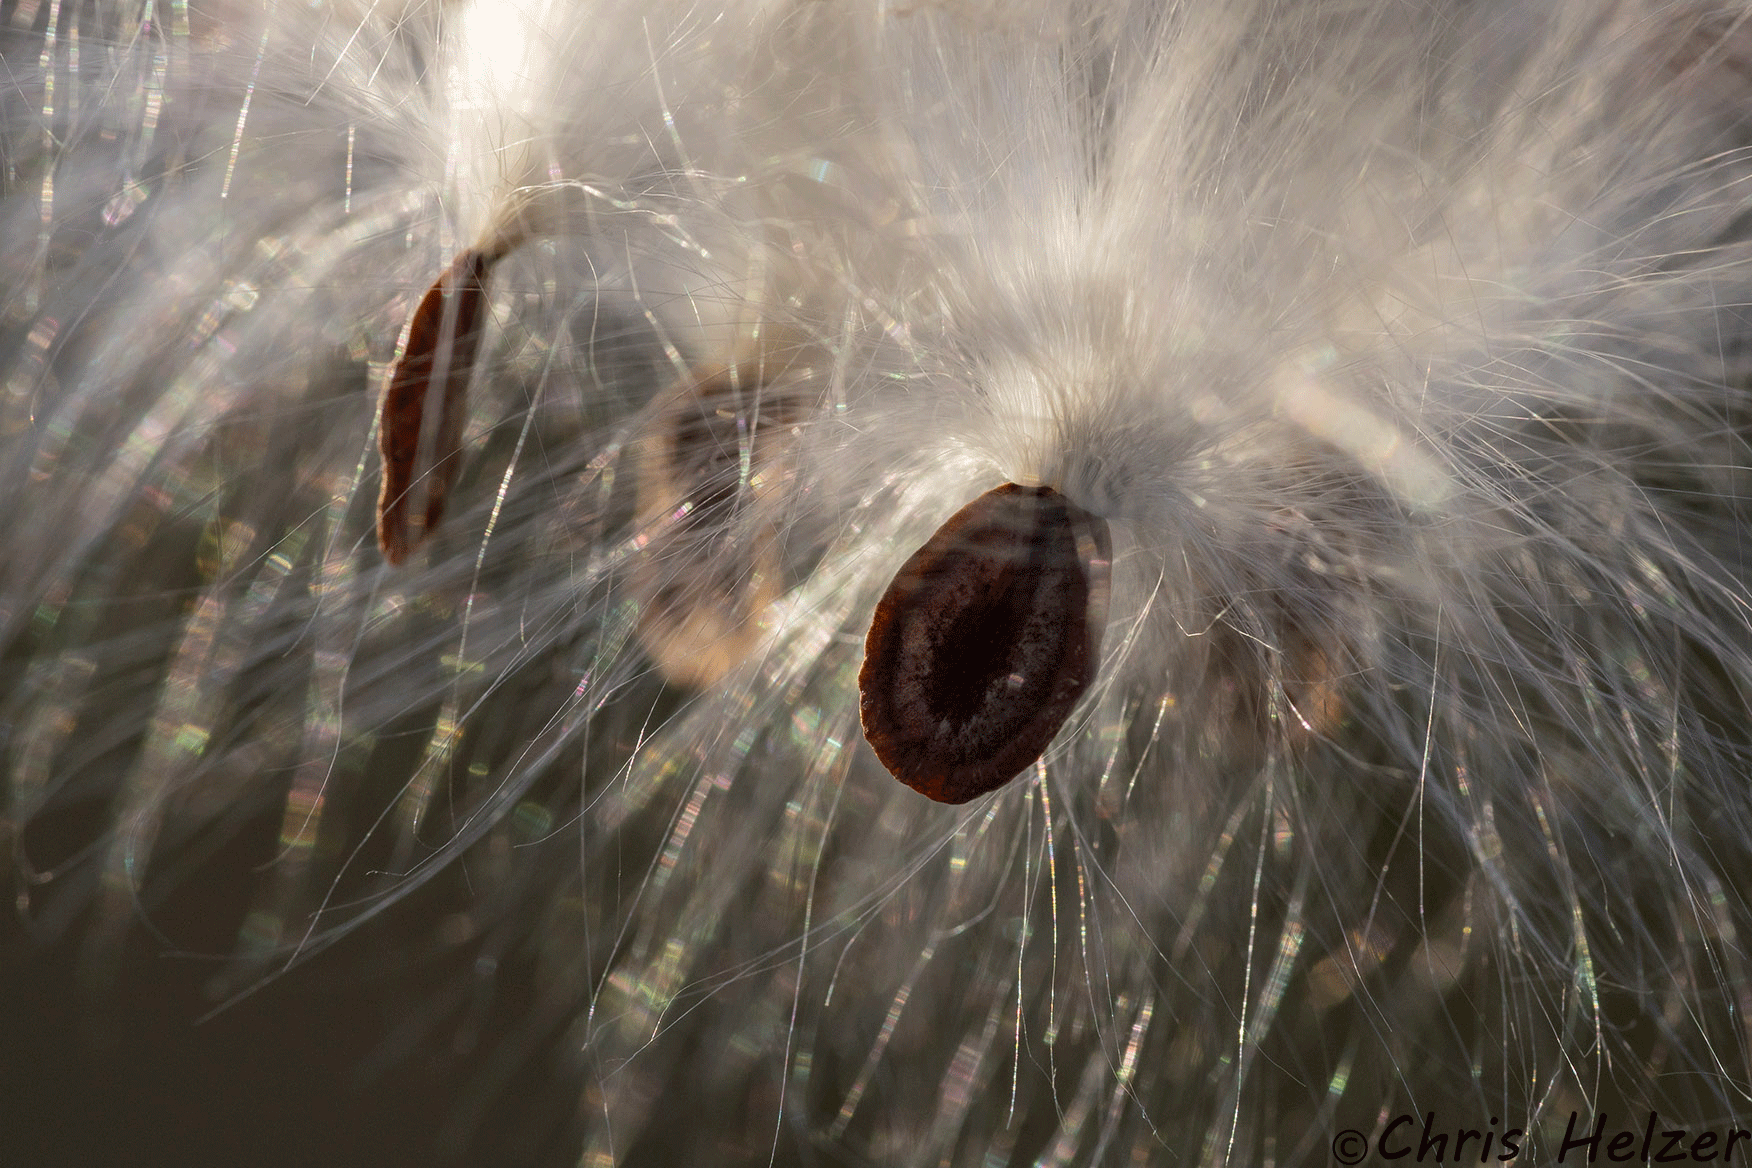
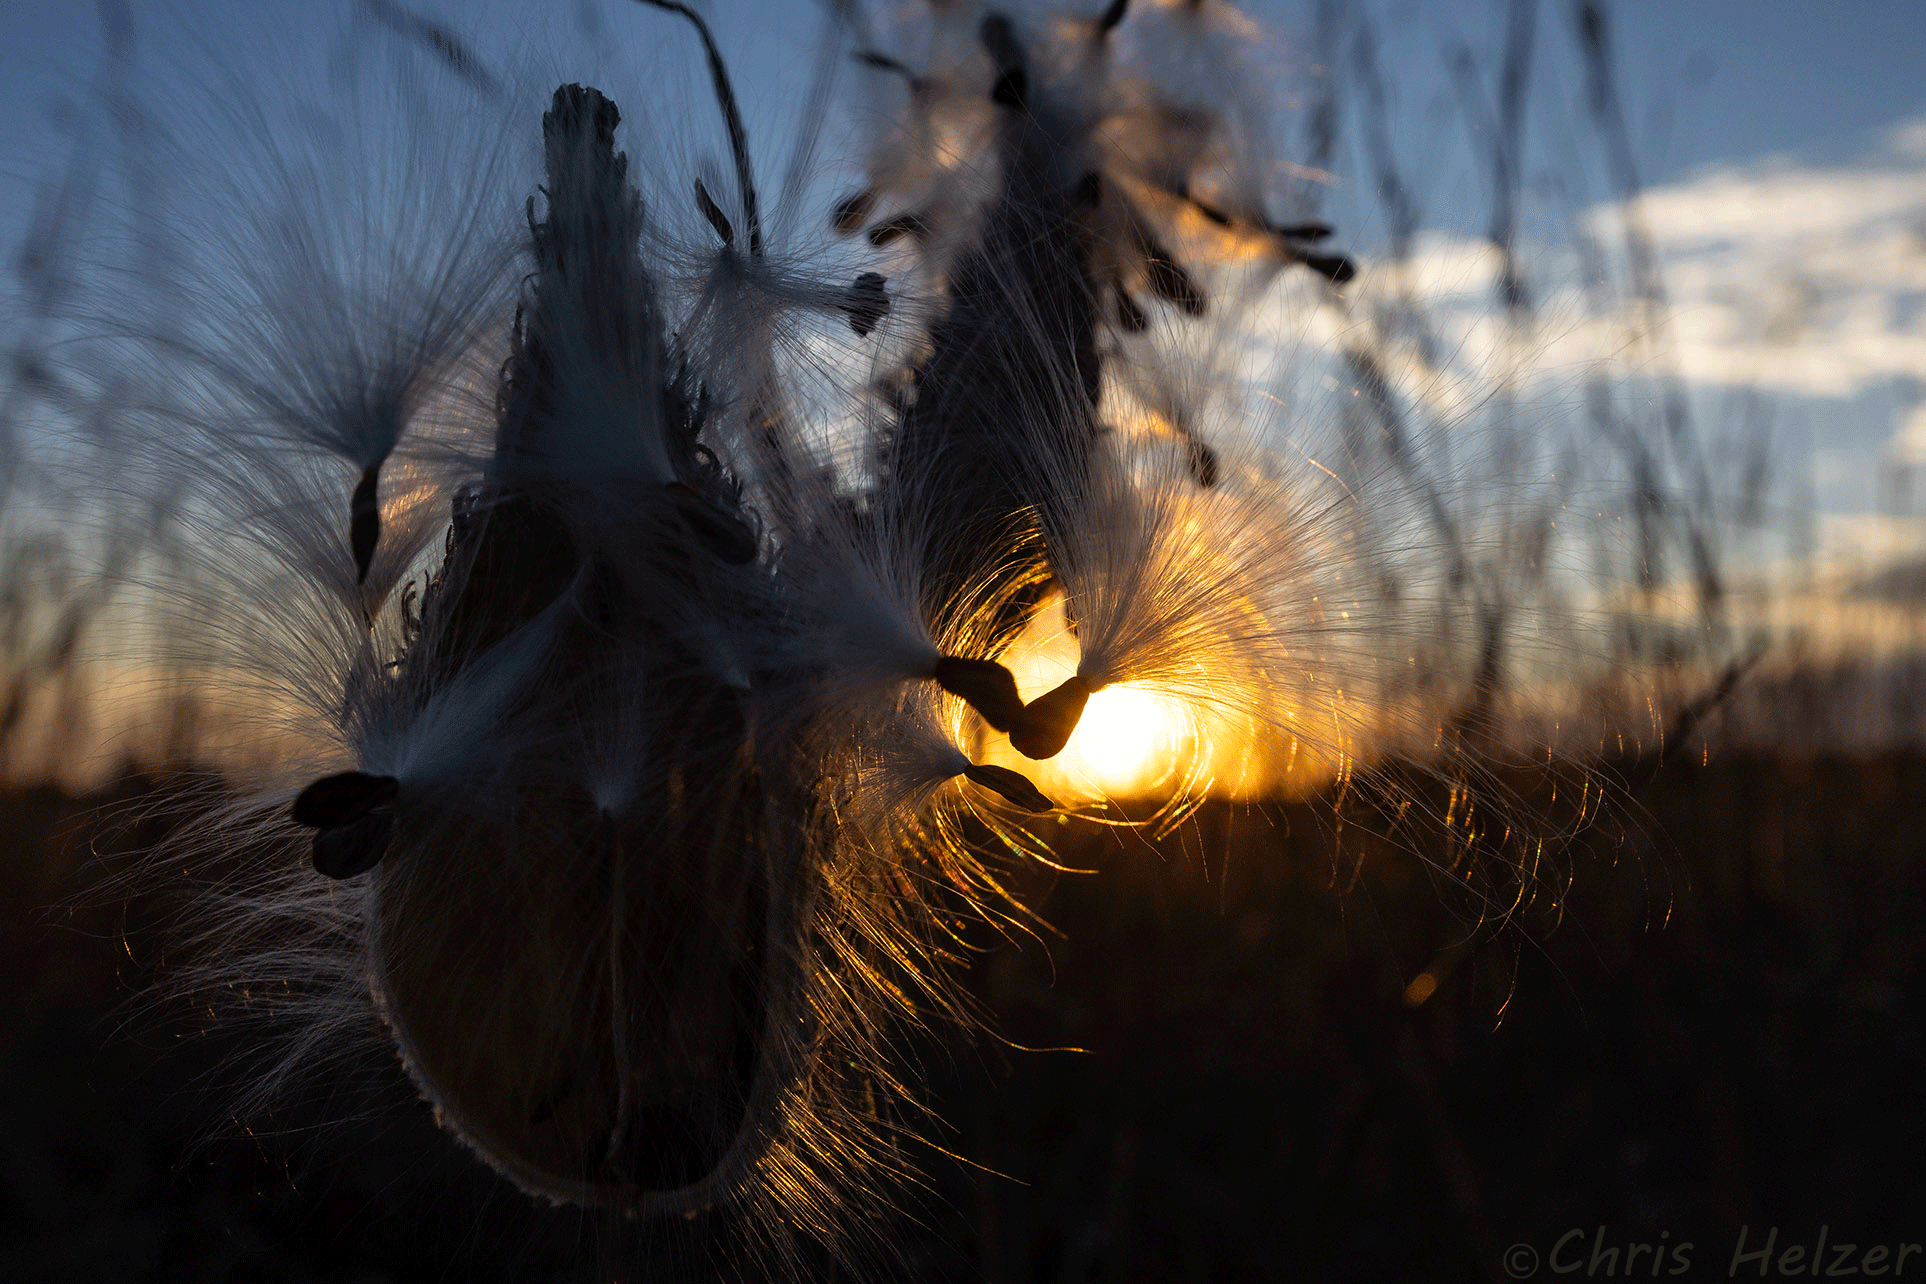
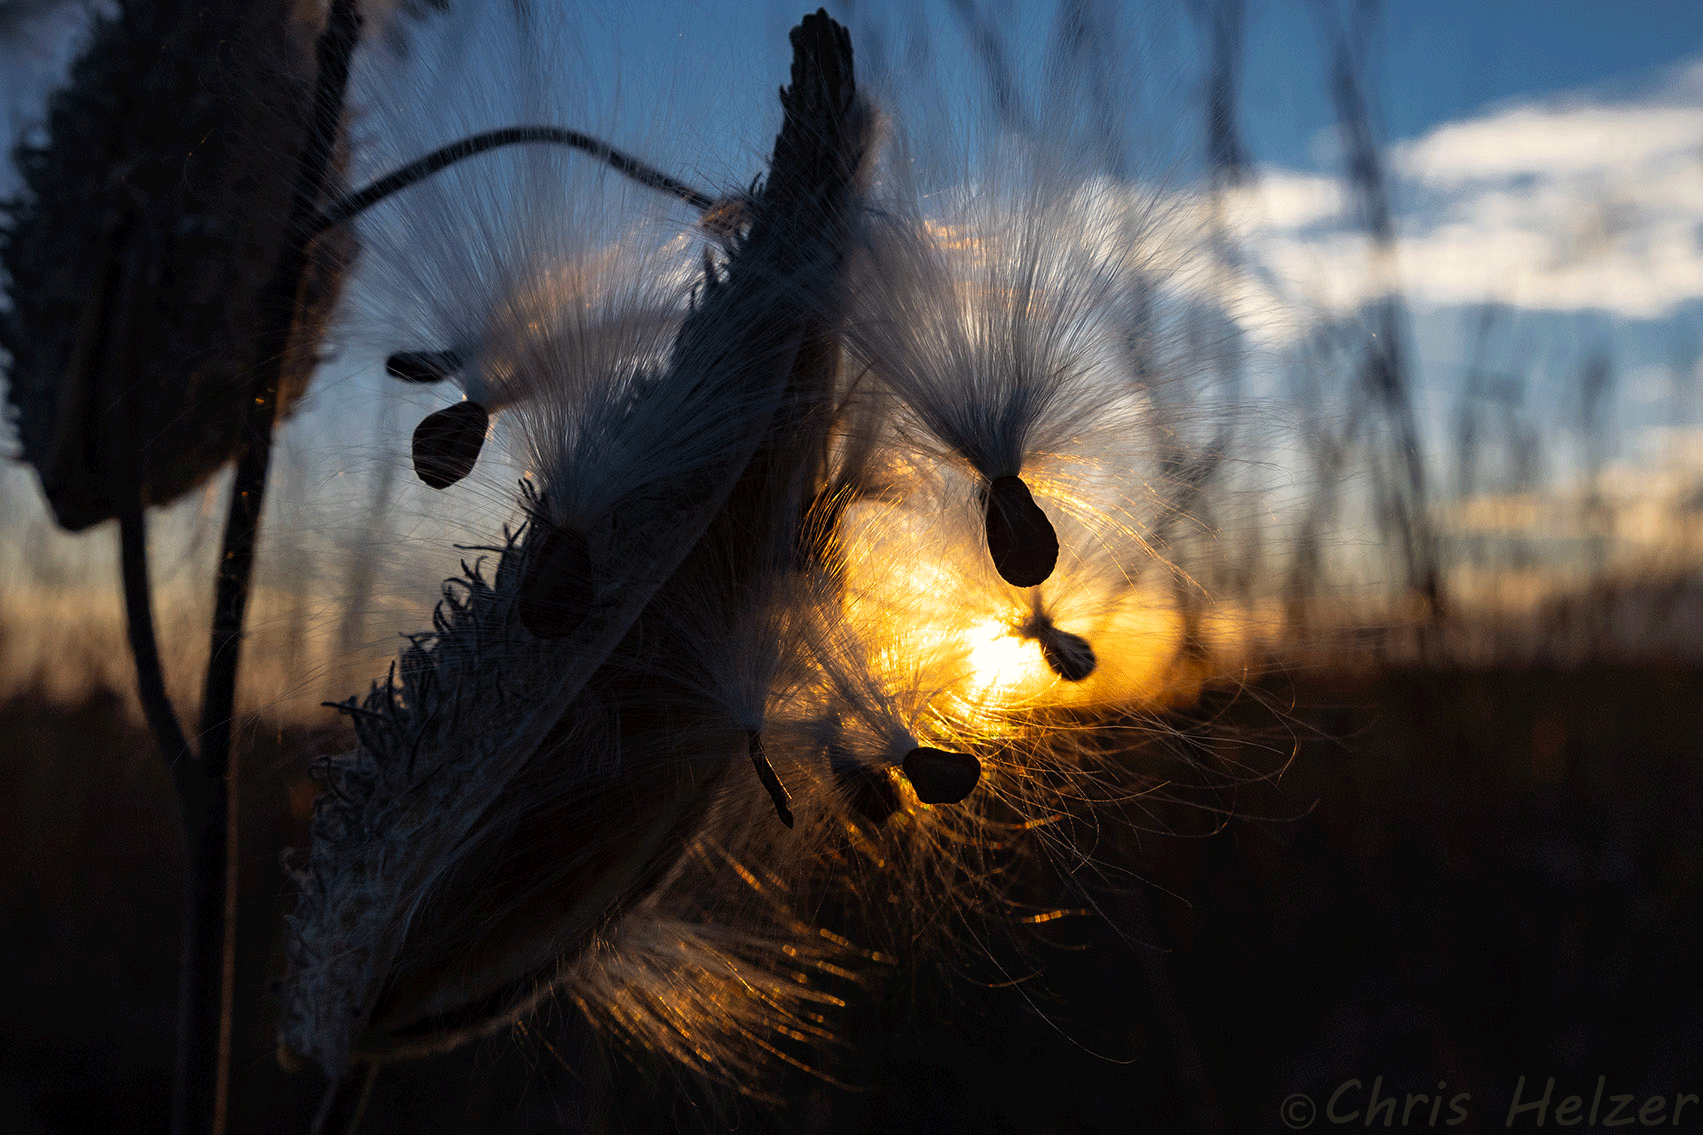
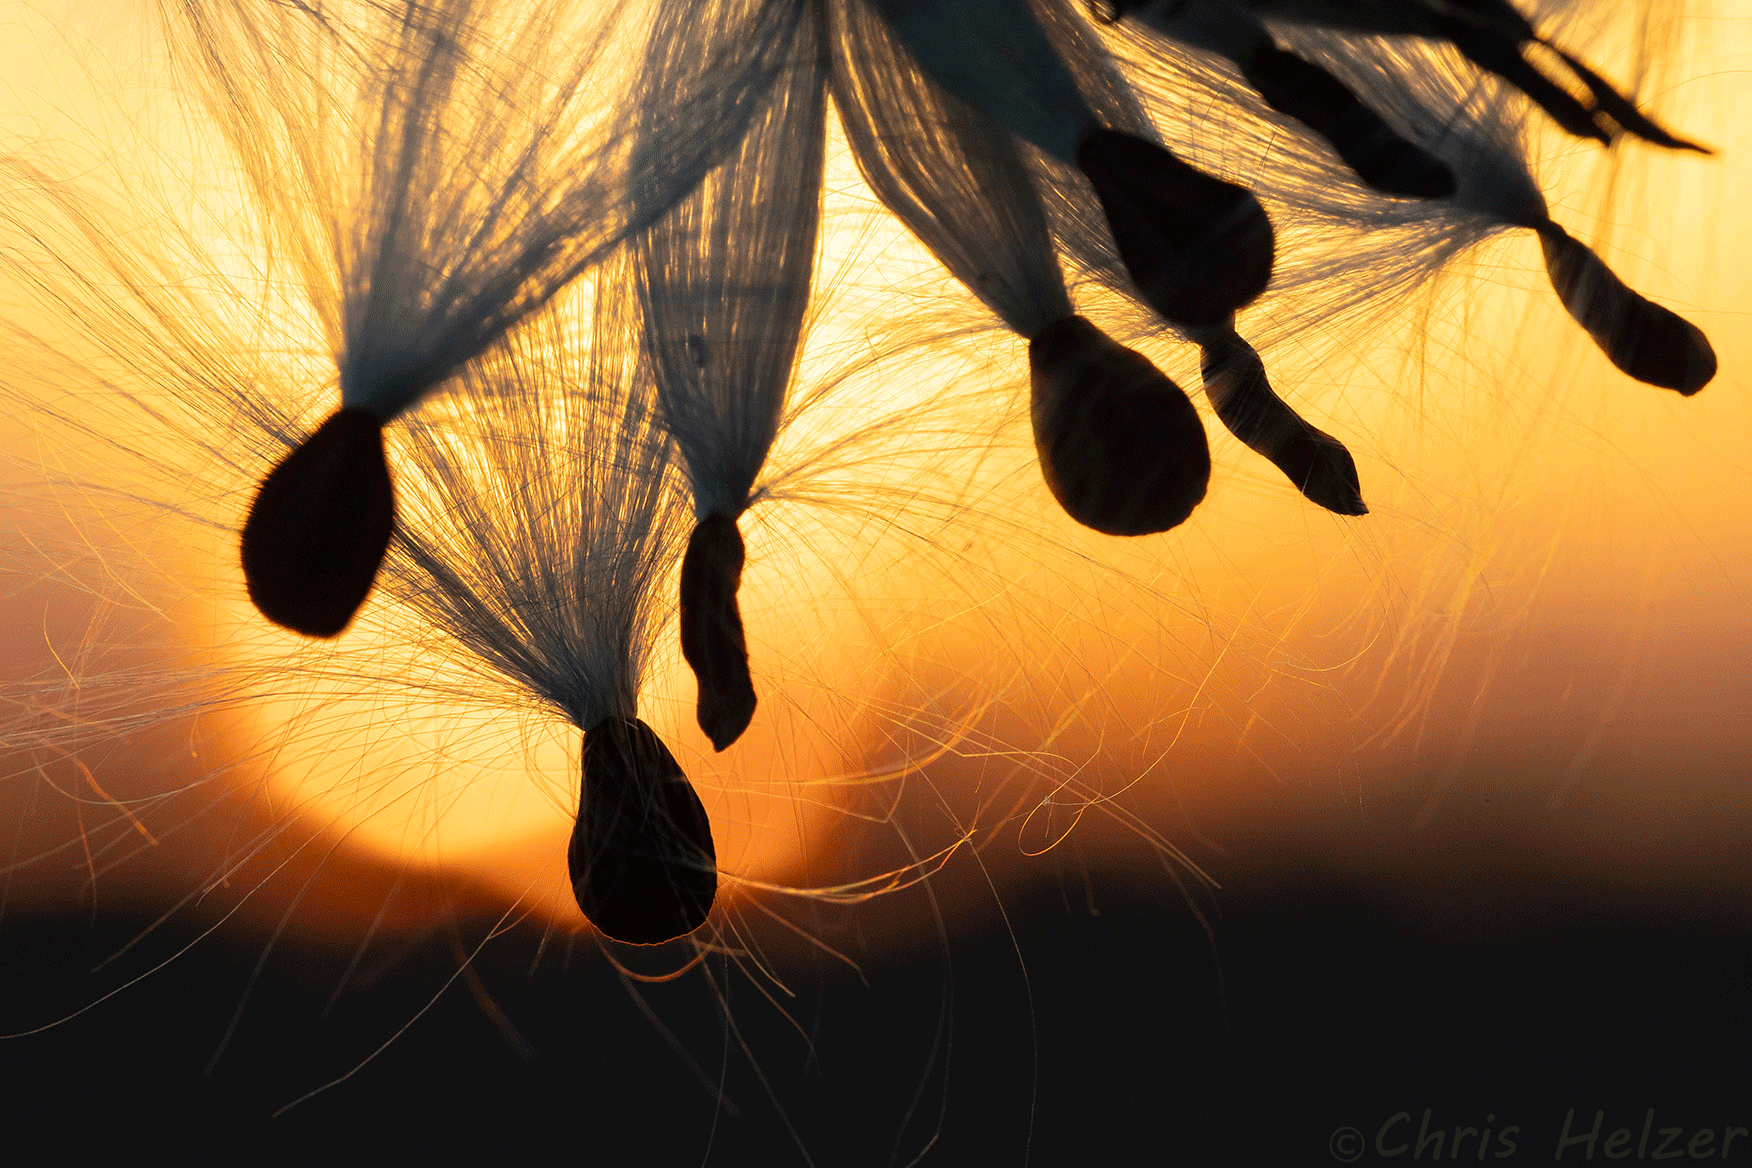
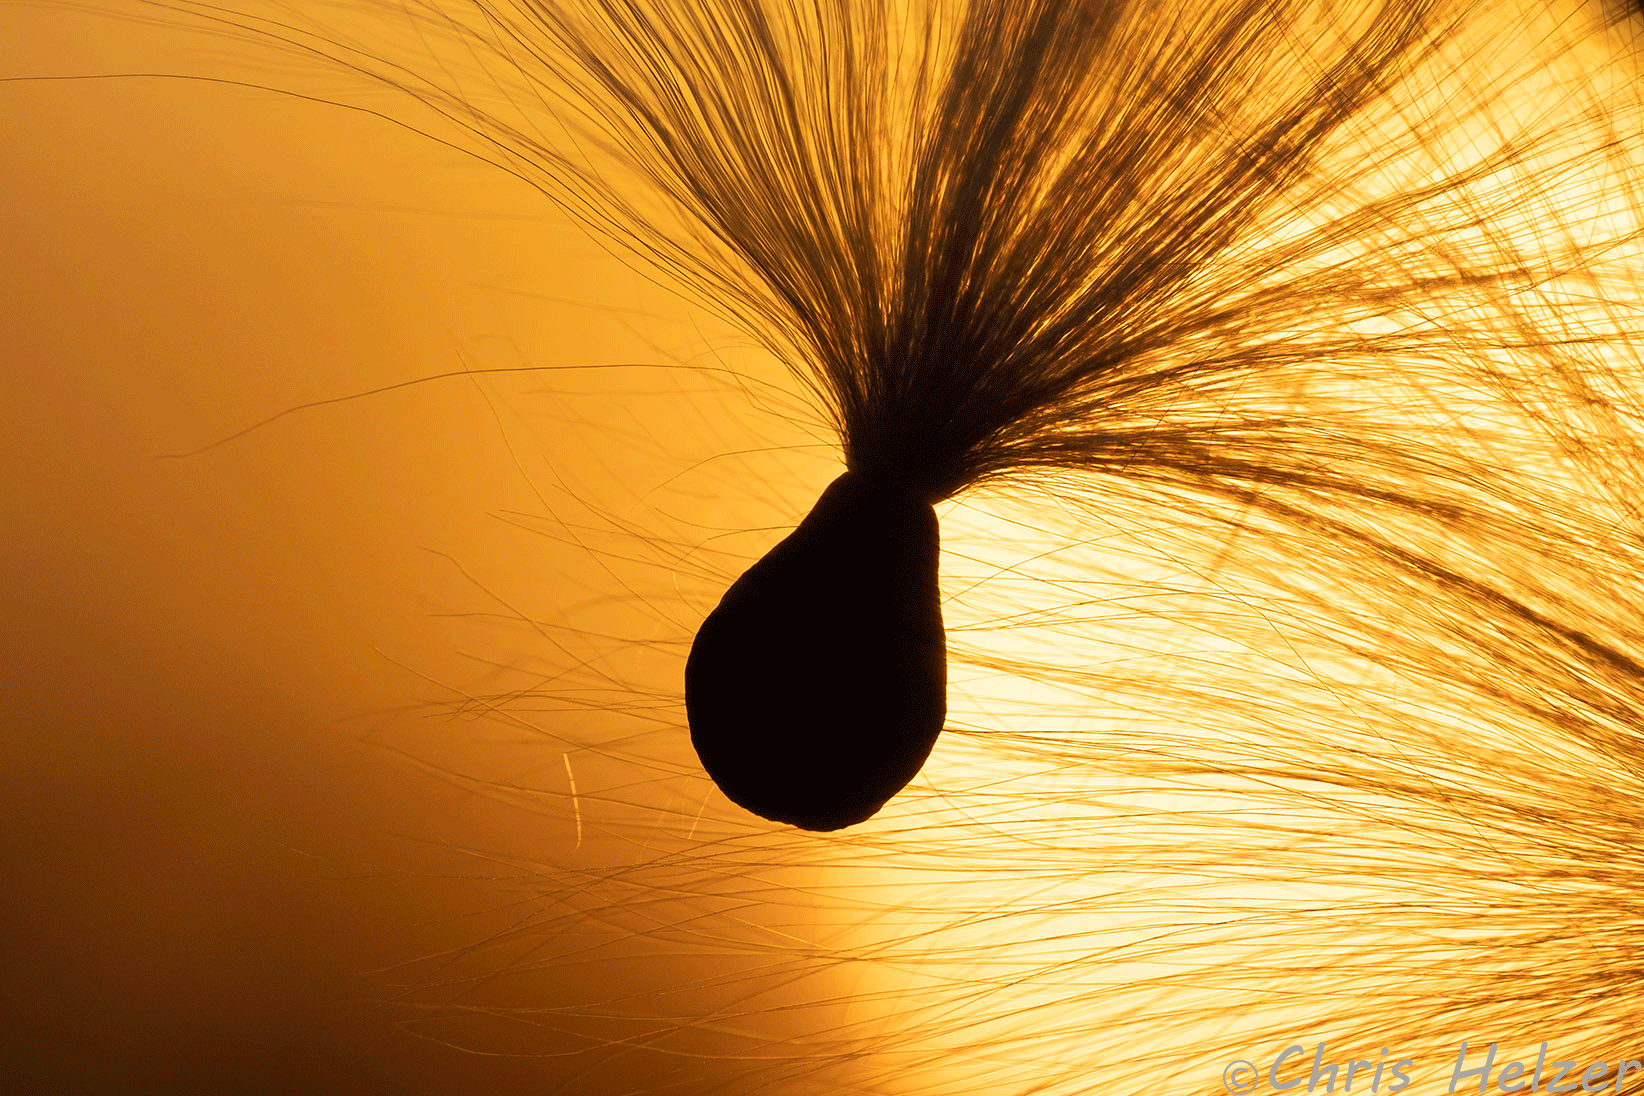
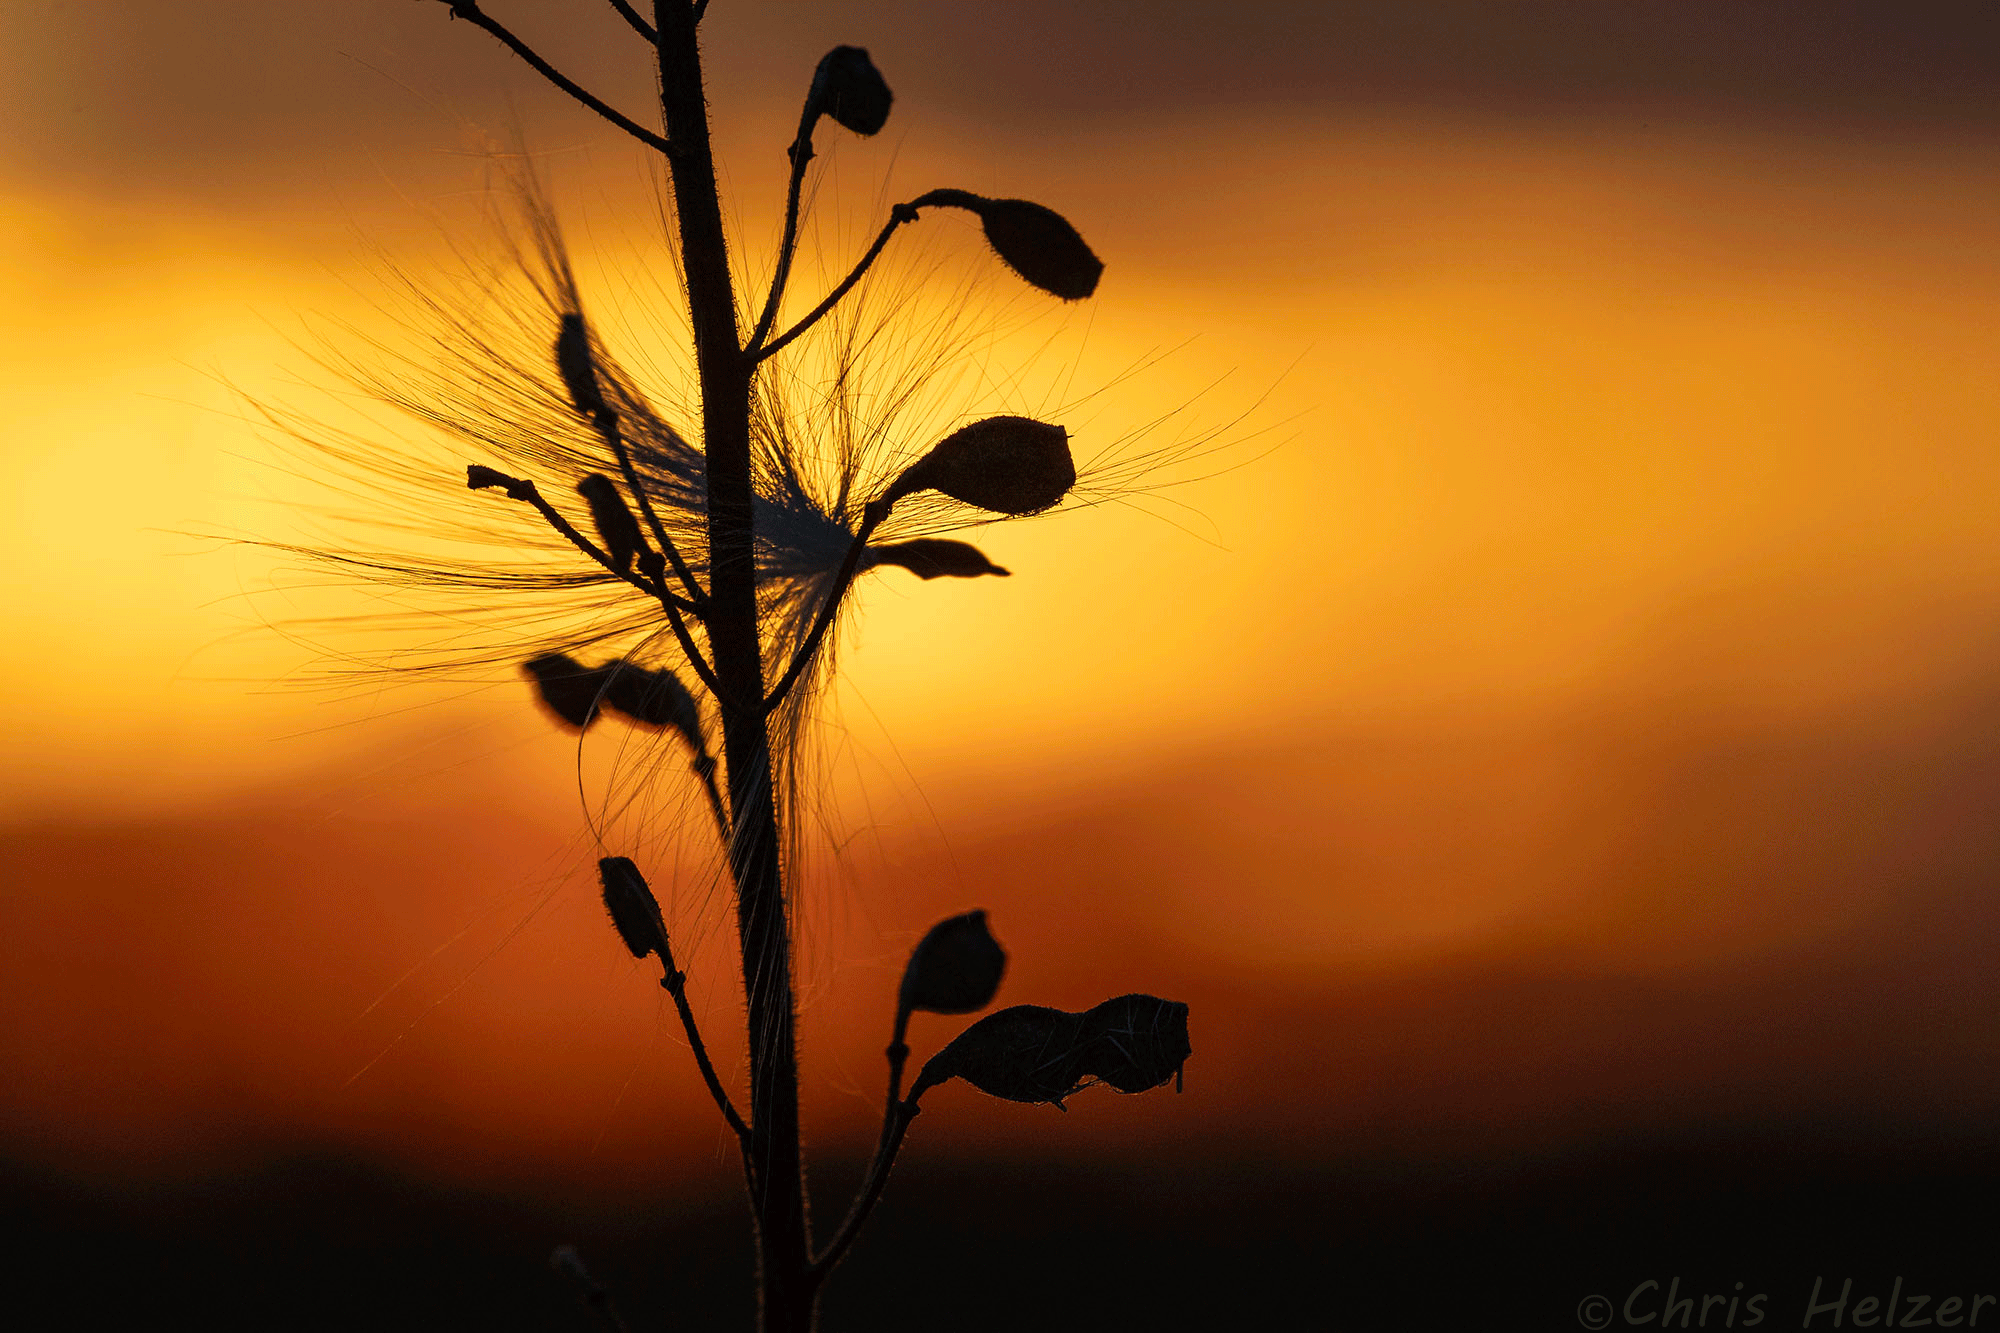
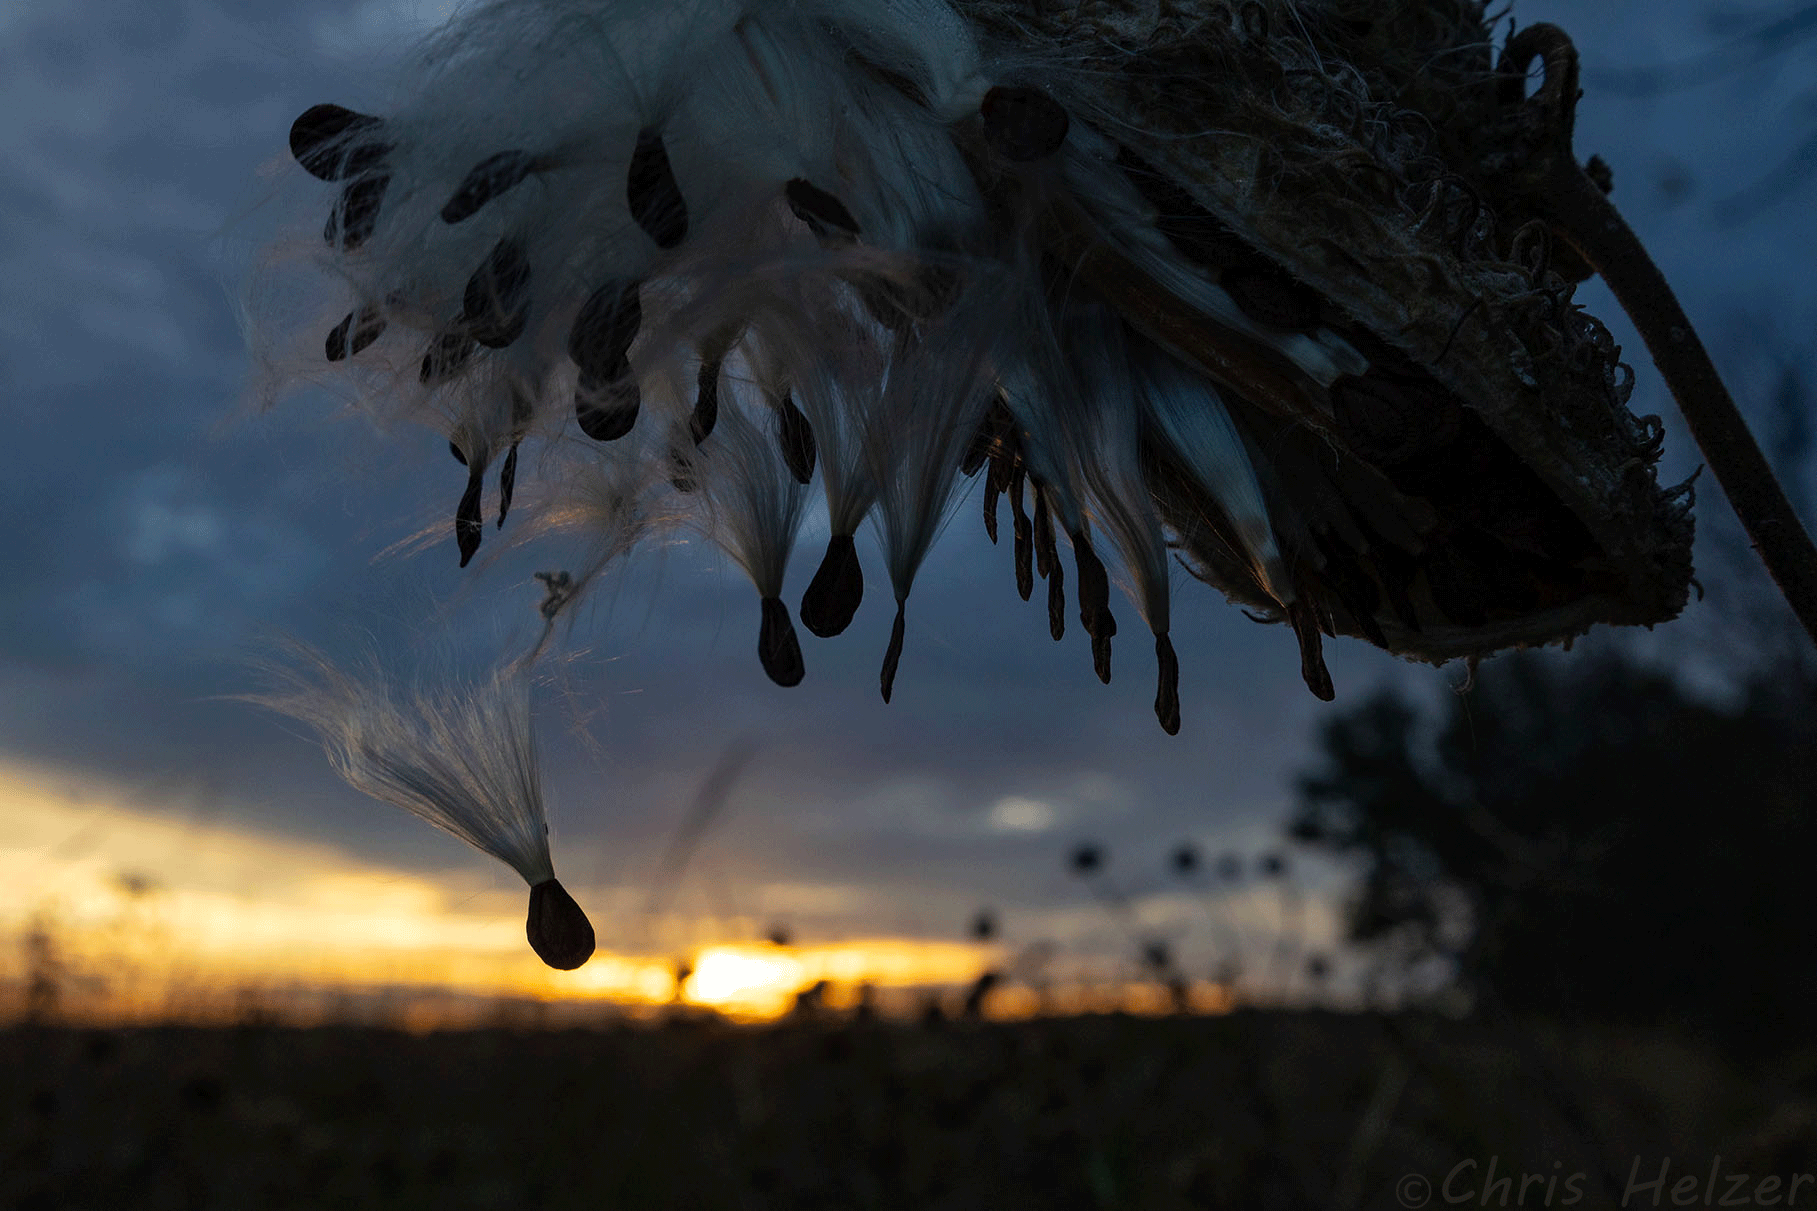
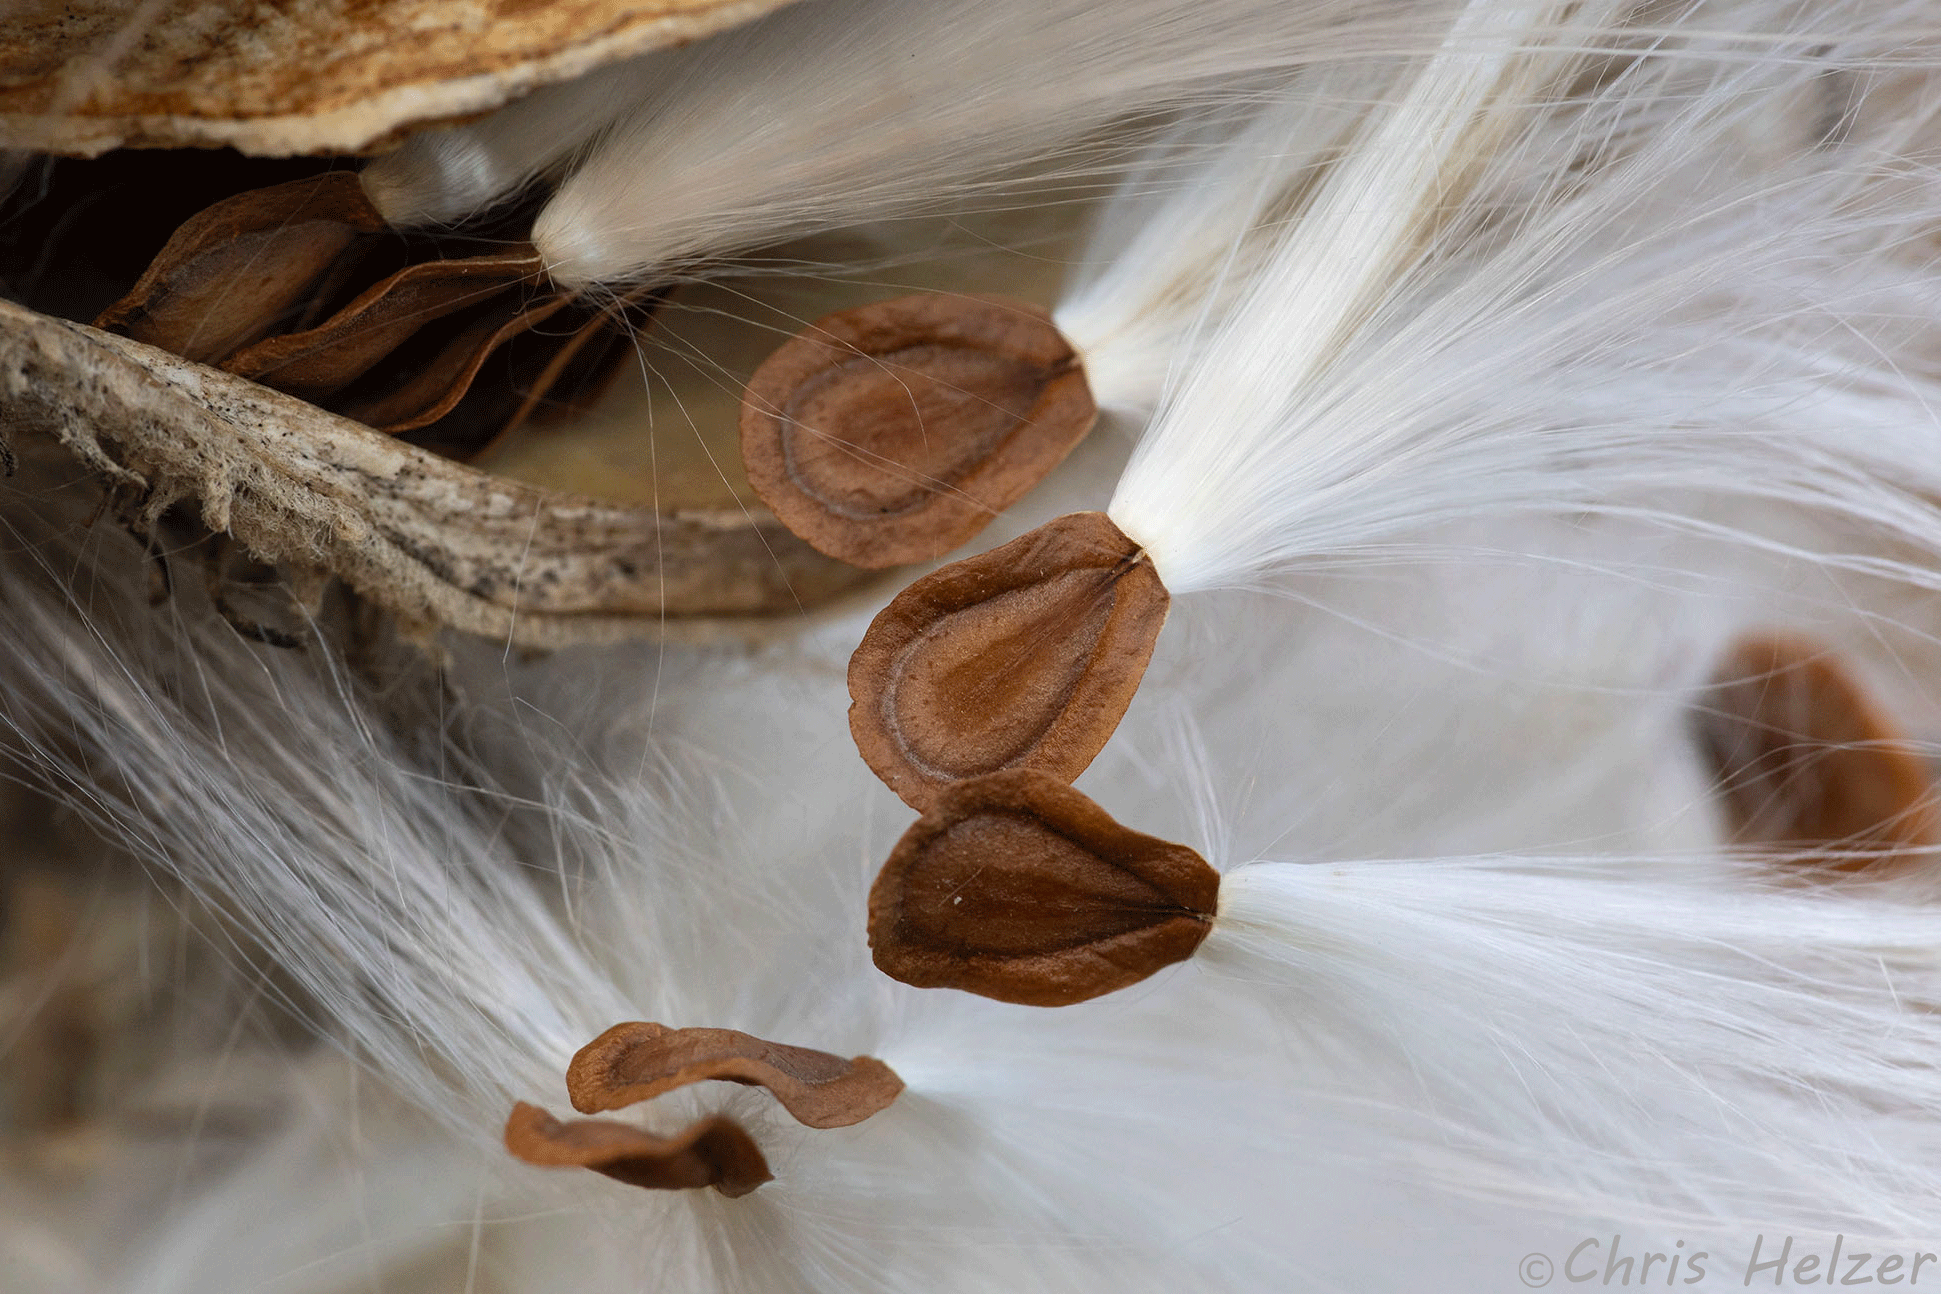
I have, of course, continued my photography of milkweed seeds. You might be getting tired of seeing them but I’m not. Feel free to skim past the photos but I’m going to keep putting them in front of you.
This photo reminded me of virga – the rain that falls from clouds but never hits the groundCommon milkweed seedSeeds coming out of a milkweed faucet?Backlit milkweed seeds
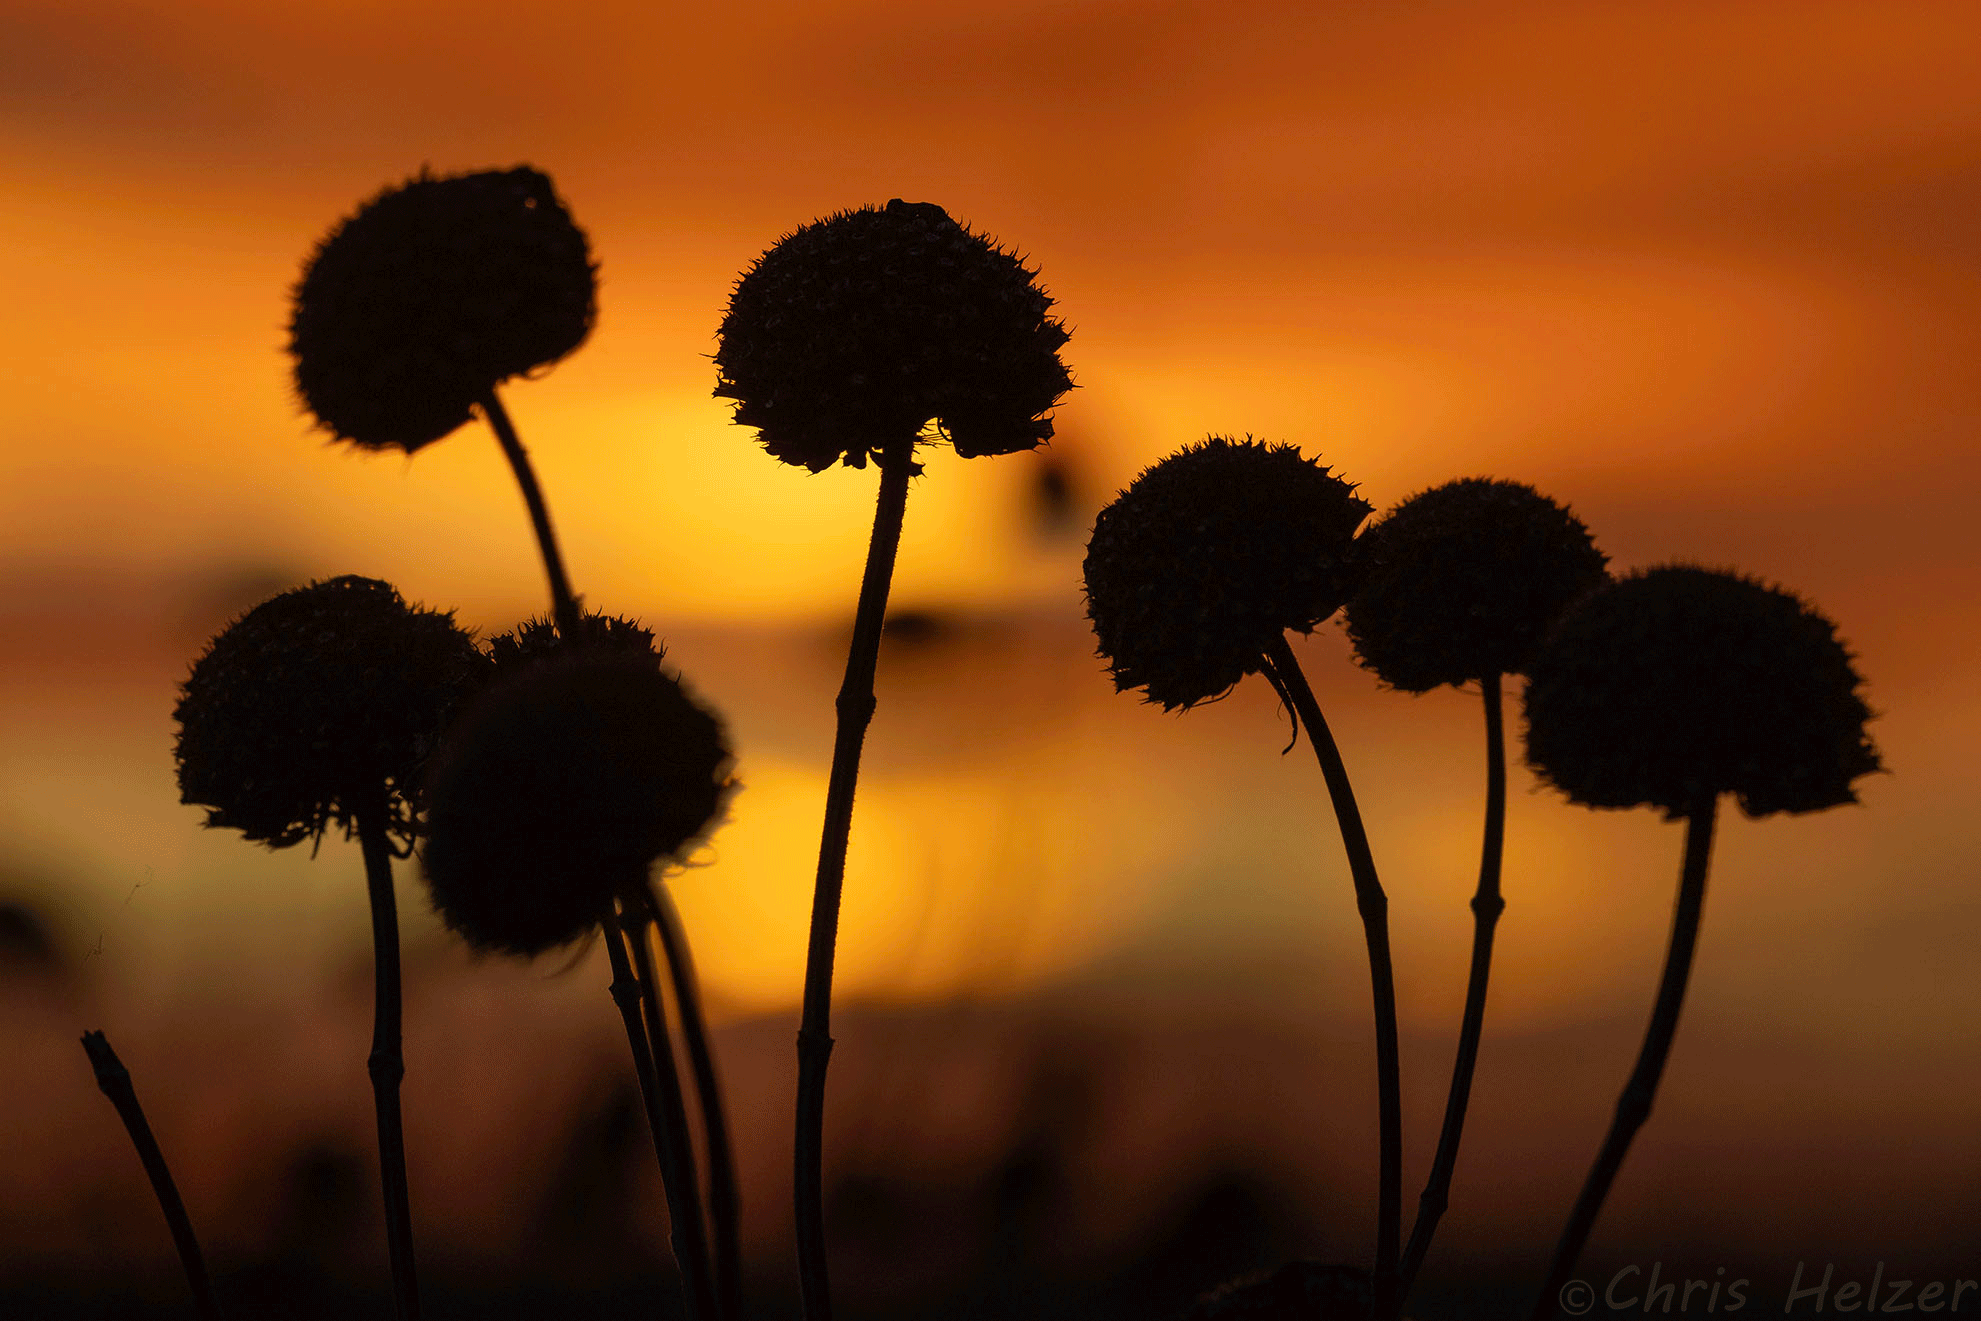
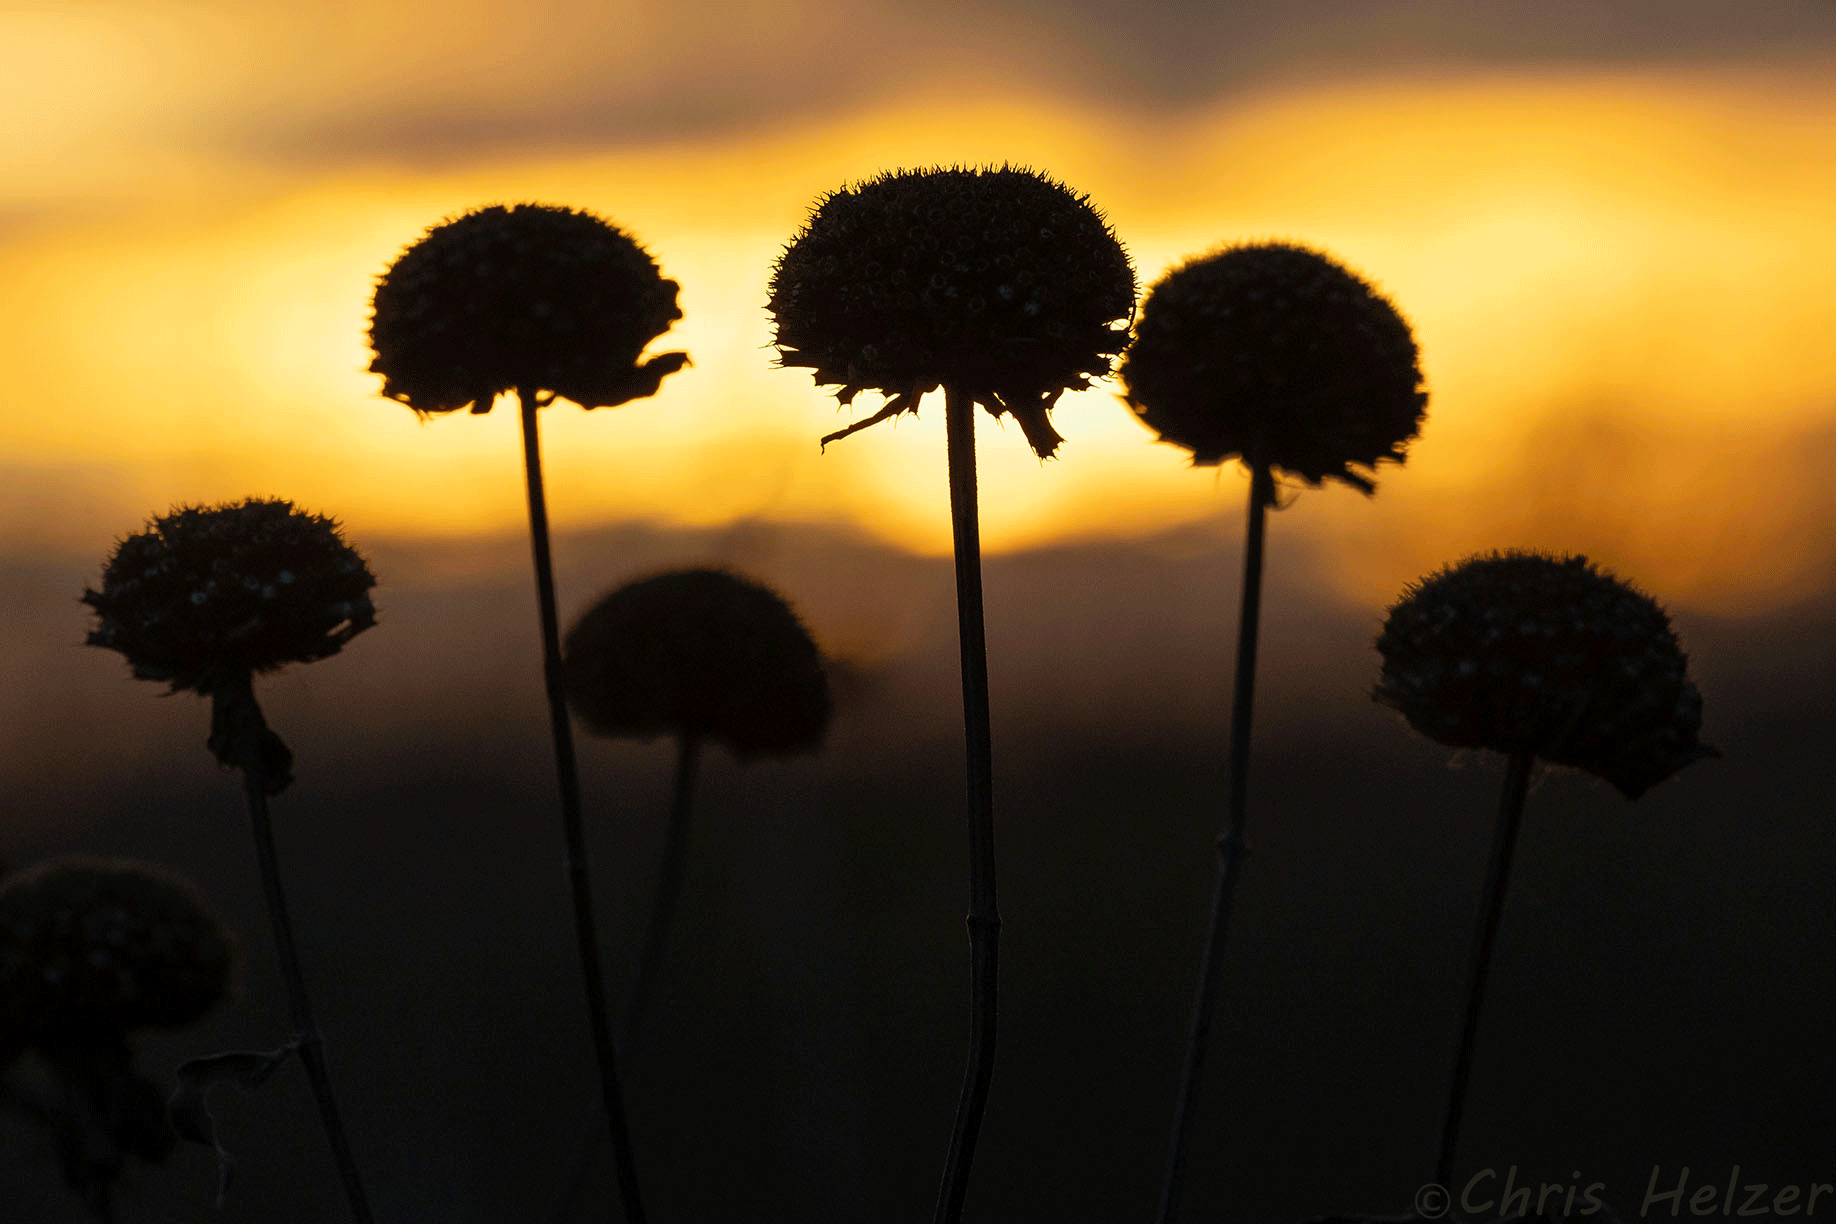
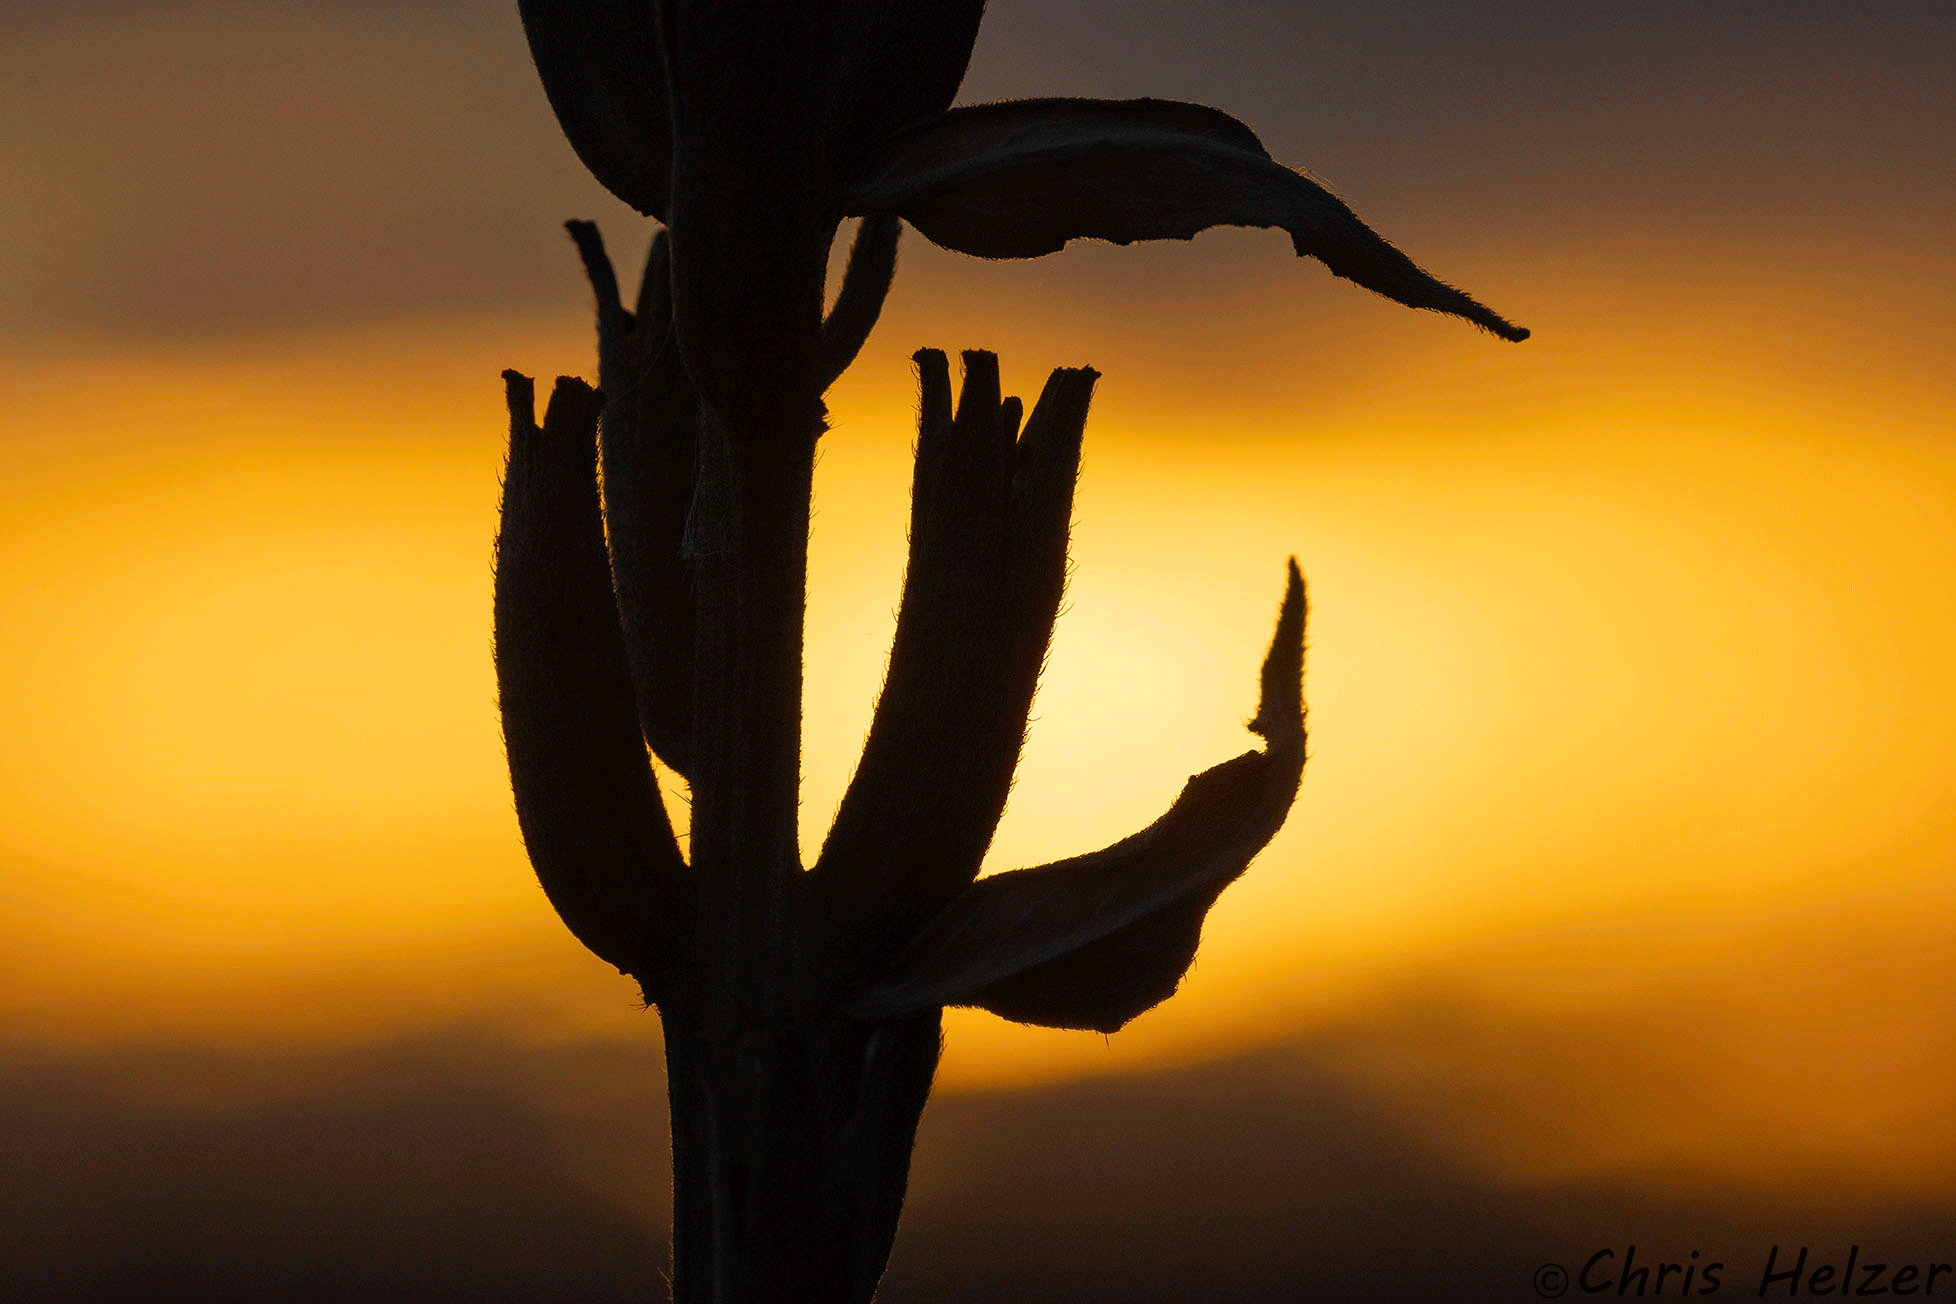
I’ve also been catching a lot of sunrises recently. It’s a lot easier to do that this time of year when the sun is coming up at almost 8am. It hardly feels like a challenge at all to get up before the sun these days. Now the challenge has switched to being able to get out to the prairie and then back to work before people expect me to be on calls or in meetings.
Sunrise and milkweed pod #1Sunrise and milkweed pod #2More milkweed seeds at sunriseYet another milkweed seed at sunrise
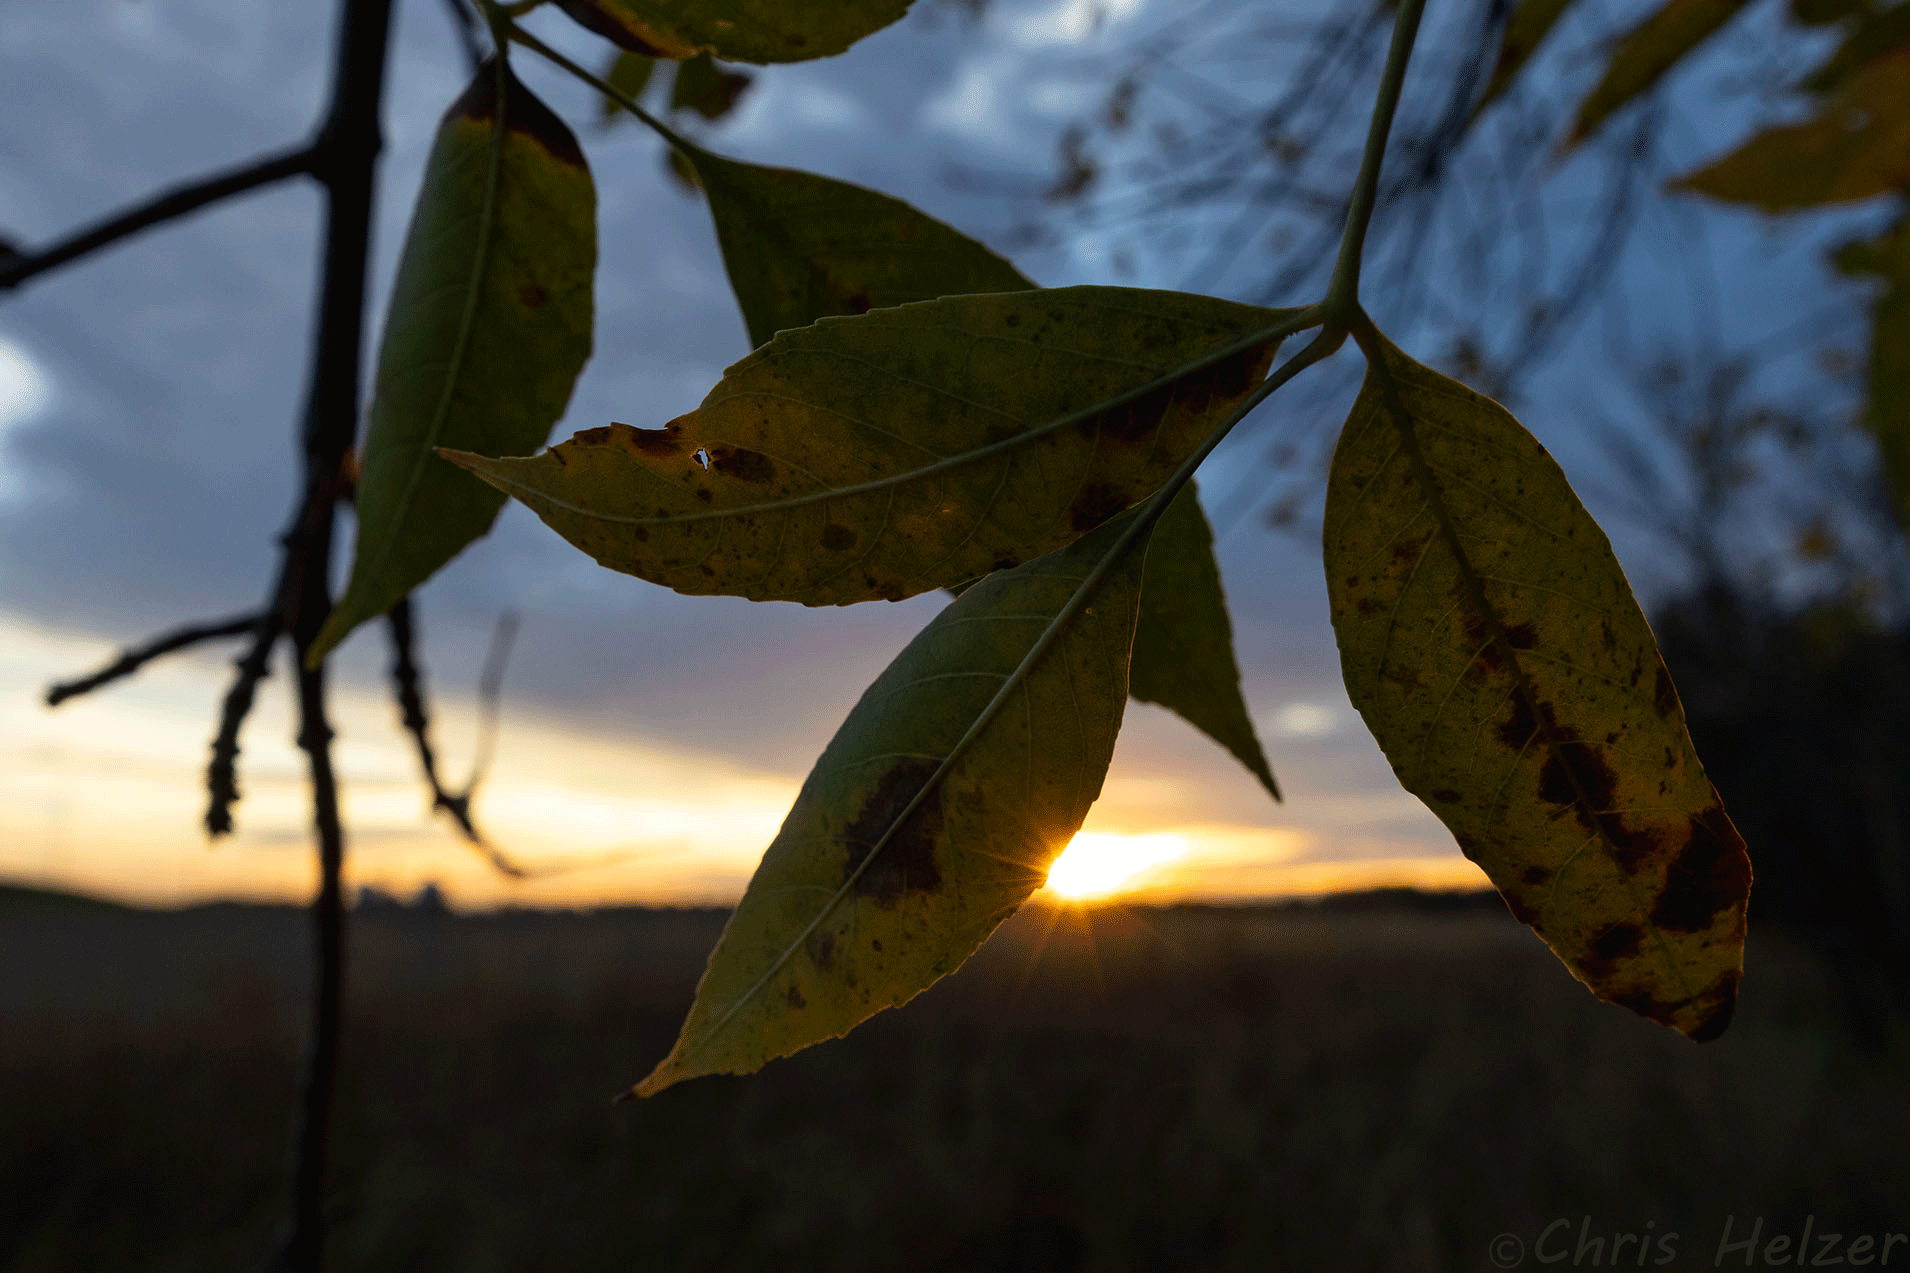
This week, I caught a sunrise at Lincoln Creek Prairie that provided some terrific color. Just as the color was starting to fade, a big bank of clouds slid slowly across the sky and gradually squeezed the light out. It was the unusual situation in which the intensity of light decreased as the sunrise progressed. Here’s a series of photos showing the photos I took as the clouds stole my light.
Peak sunrise light with wild bergamot (Monarda fistulosa)Illinois tick trefoil and a milkweed seedBergamot in front of an ever-tightening band of colorCommon evening primrose podsGreen ash leaves as the clouds swallowed the sunMilkweed seeds just before the light disappearedMilkweed seeds after the sun went behind the cloudsLast shot of the morning – wild bergamot
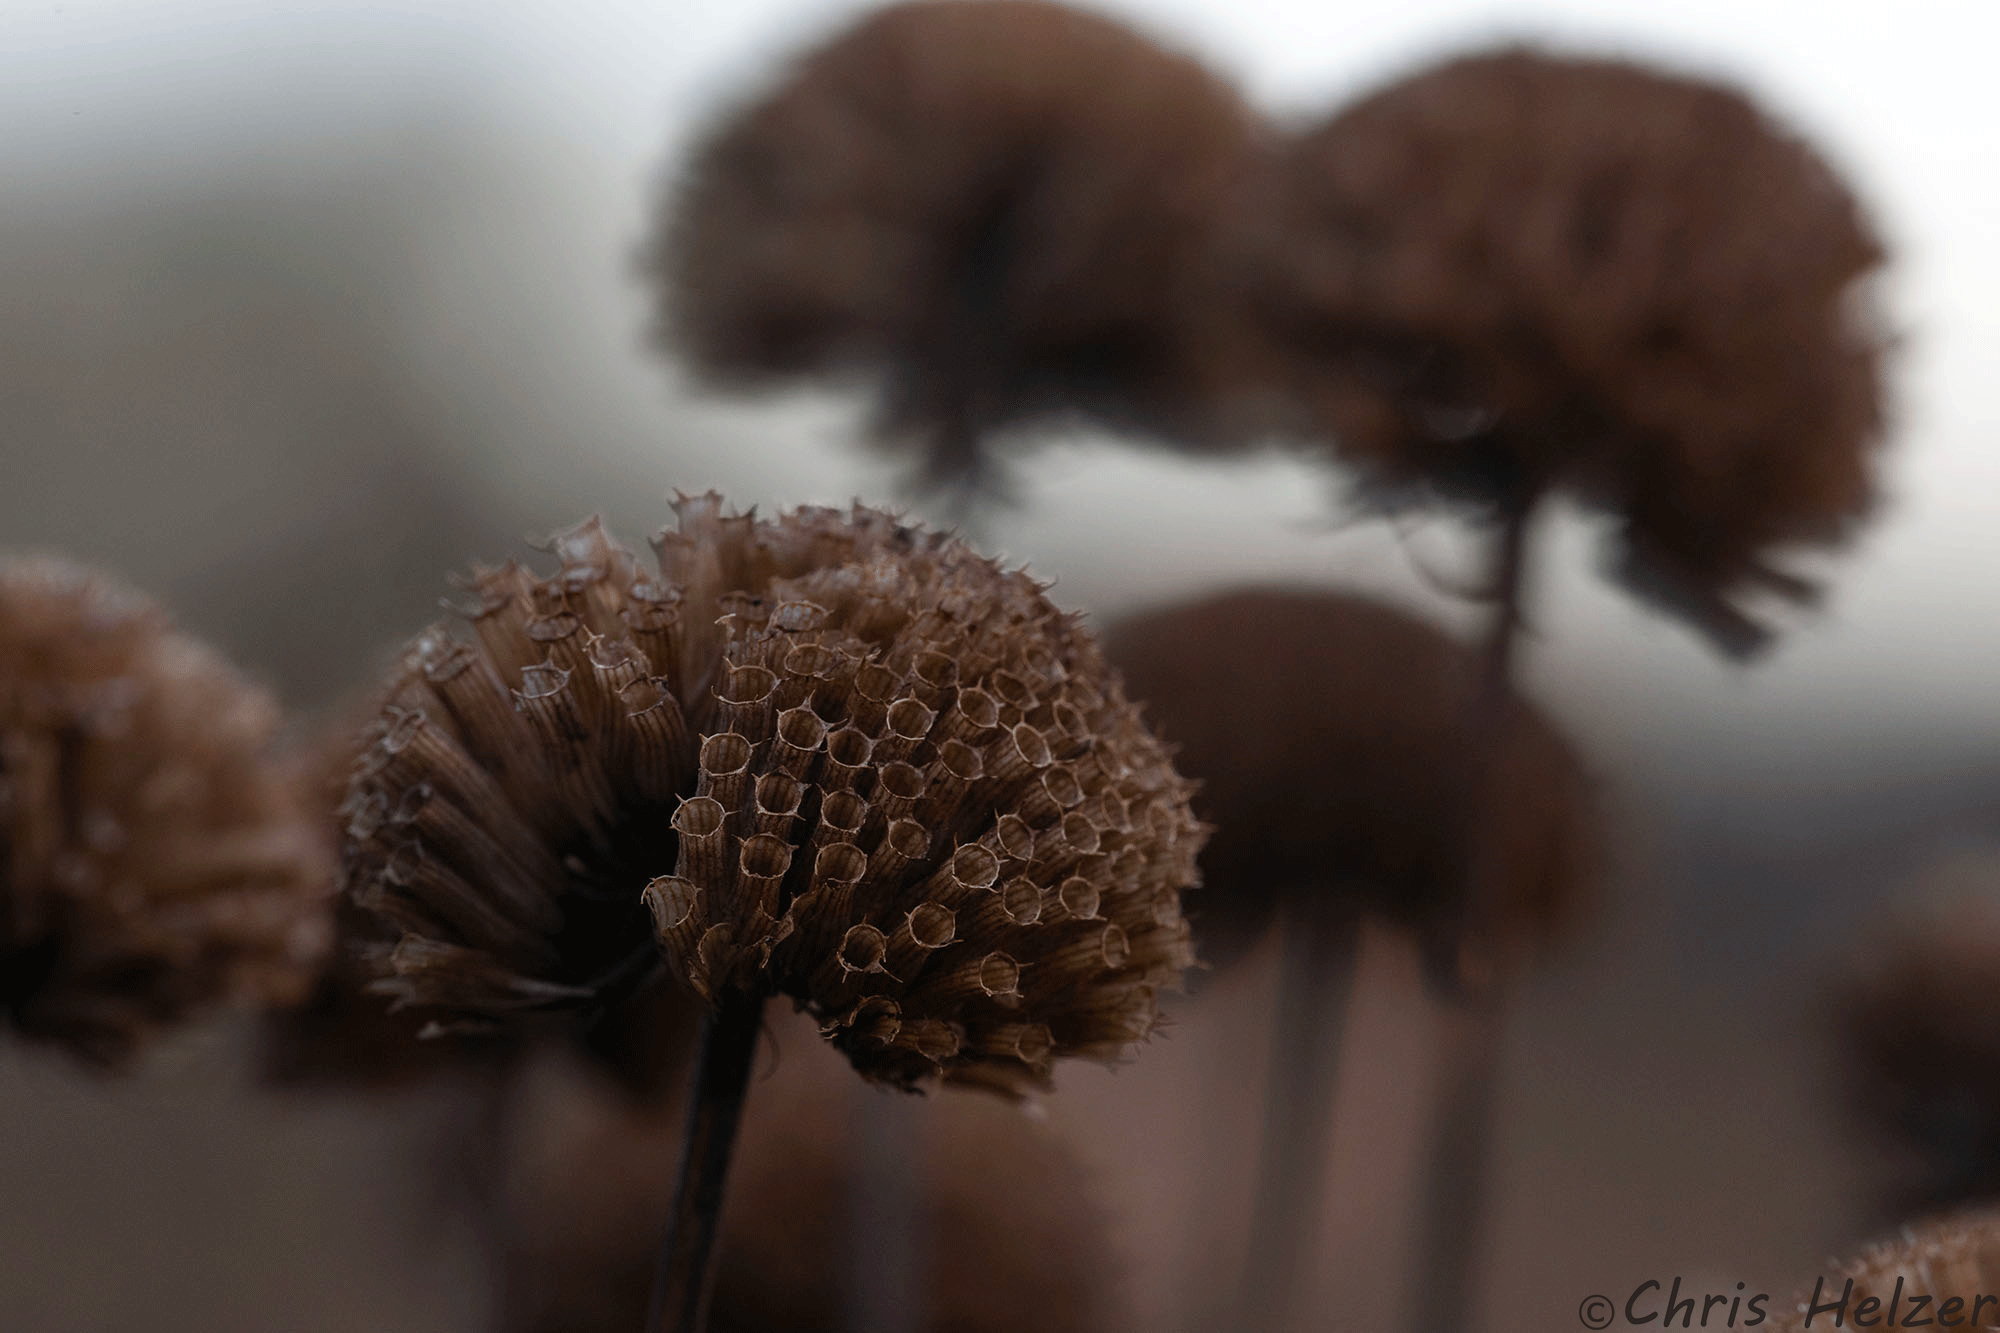
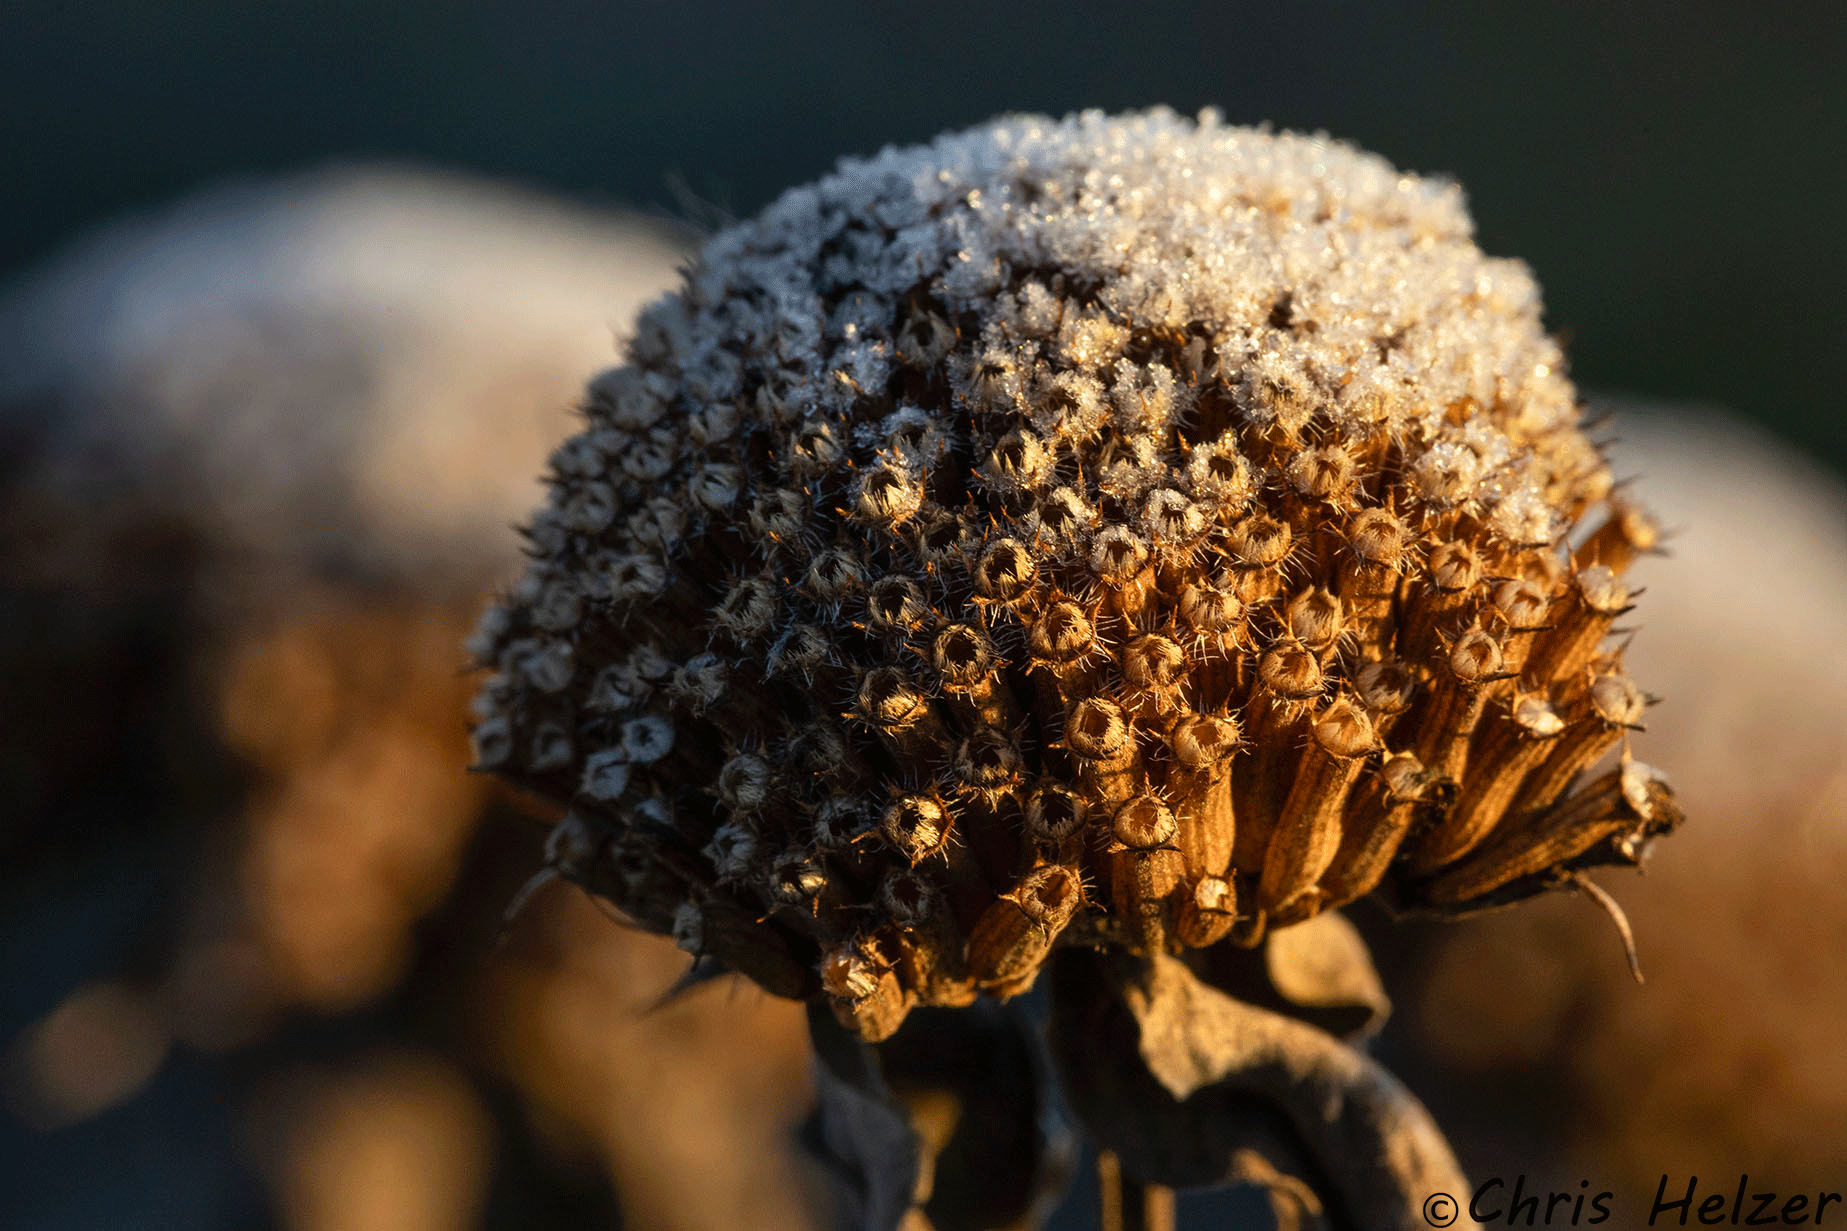
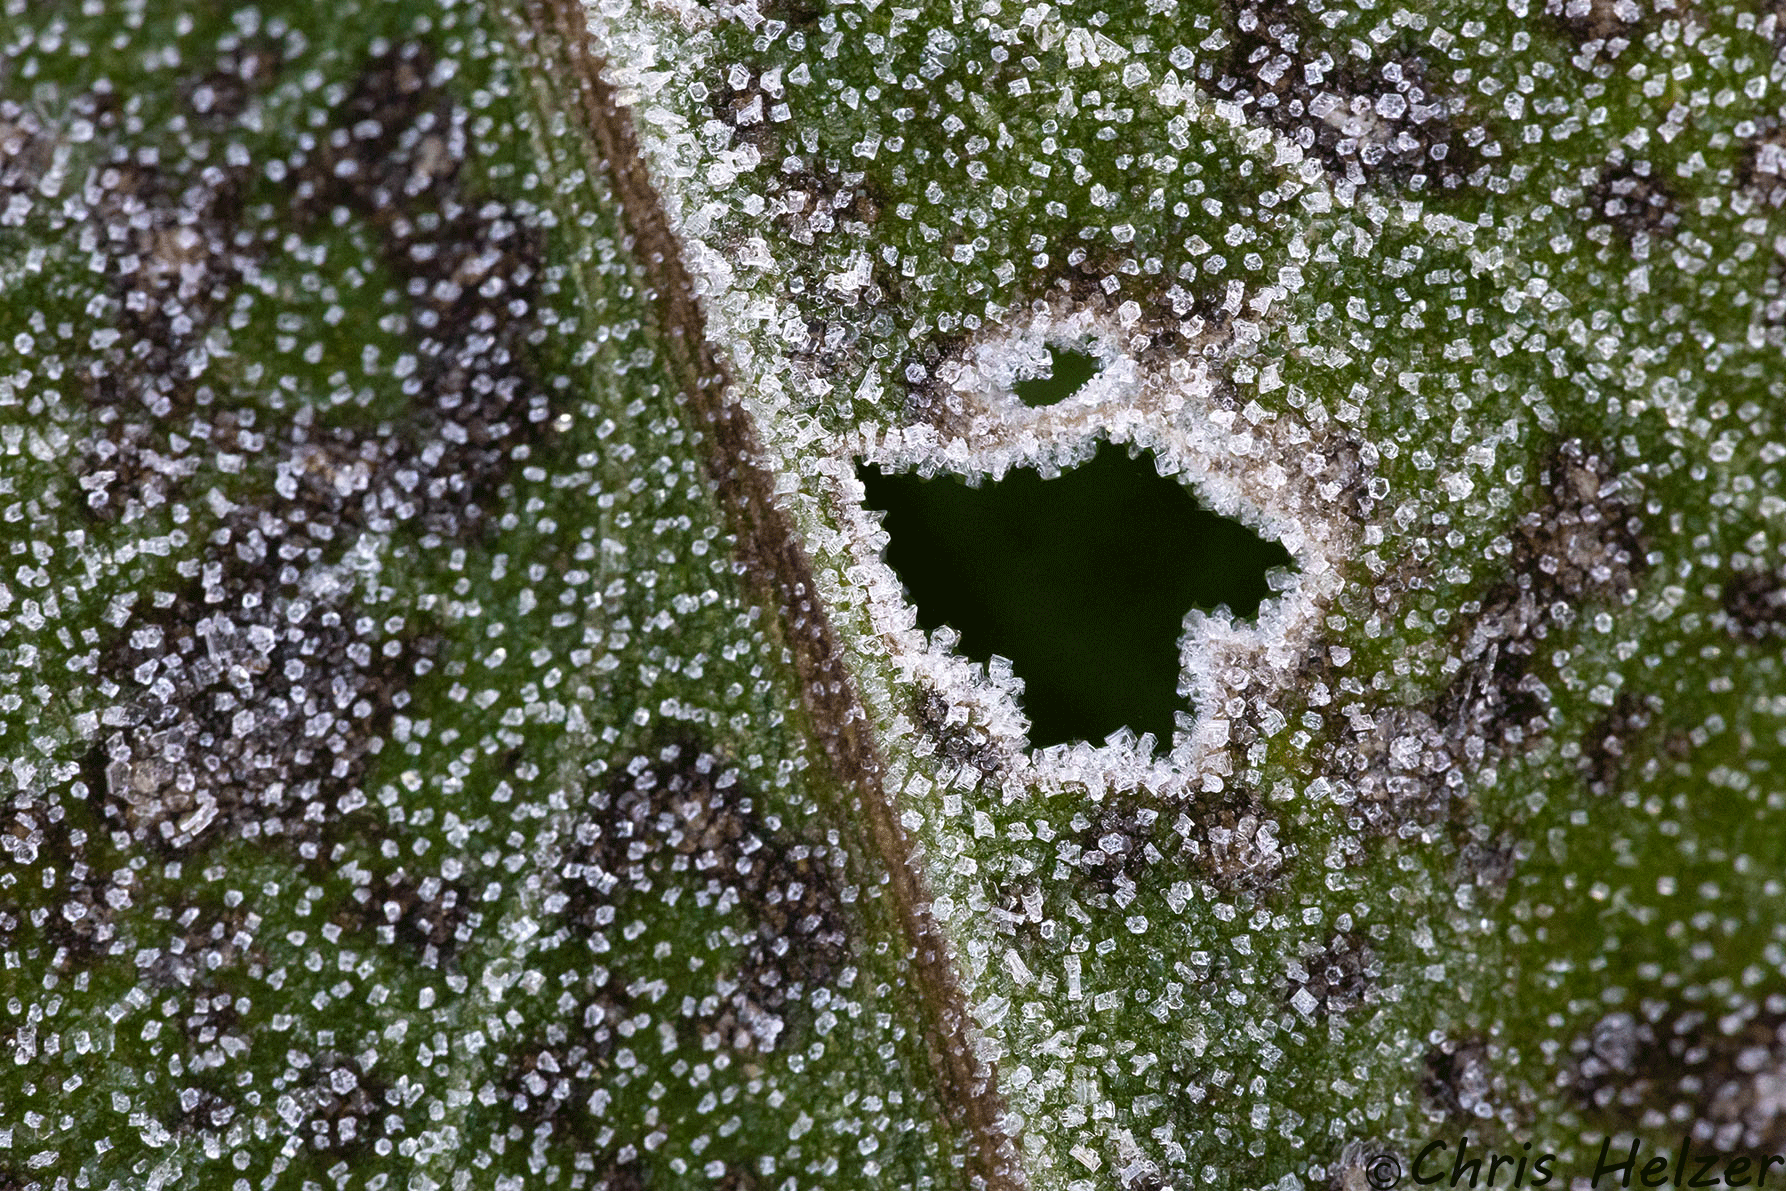
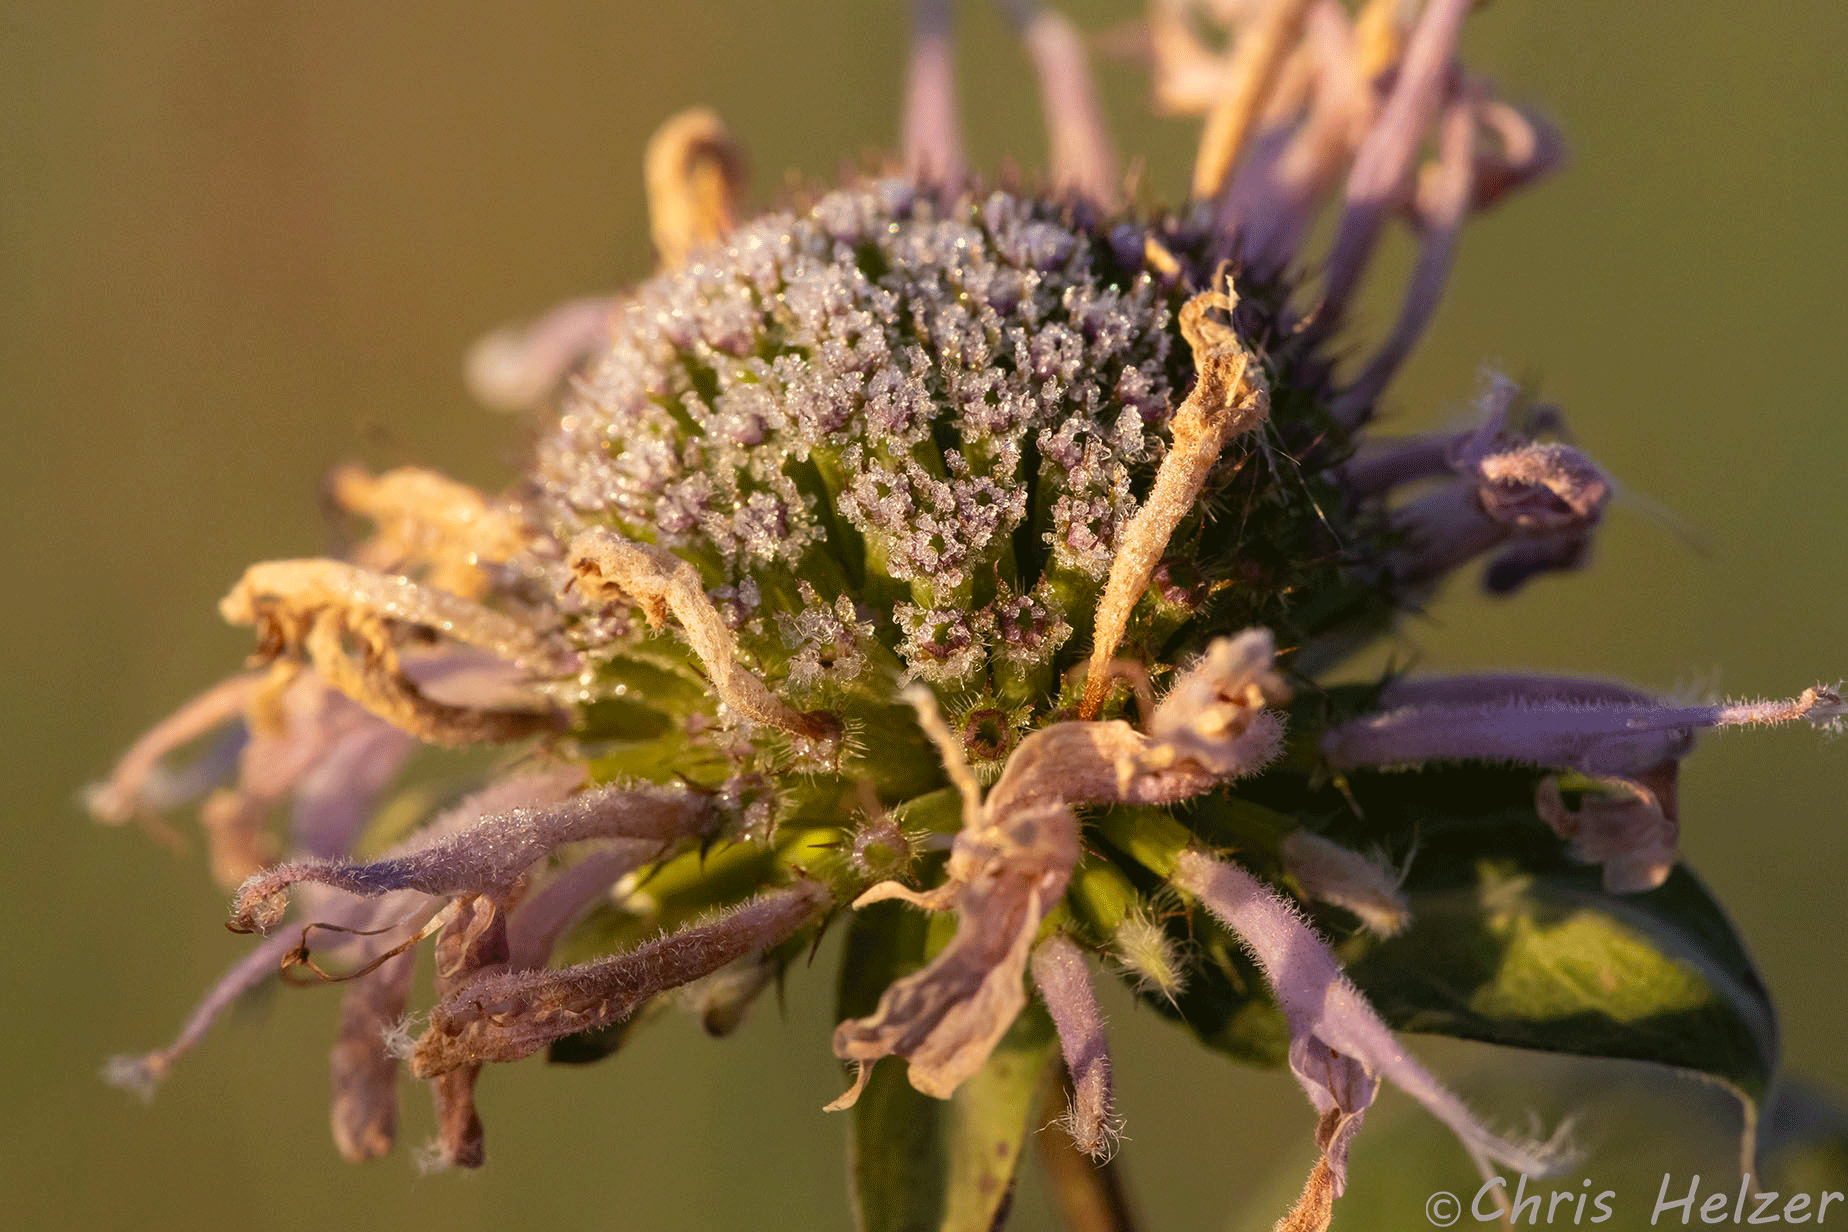
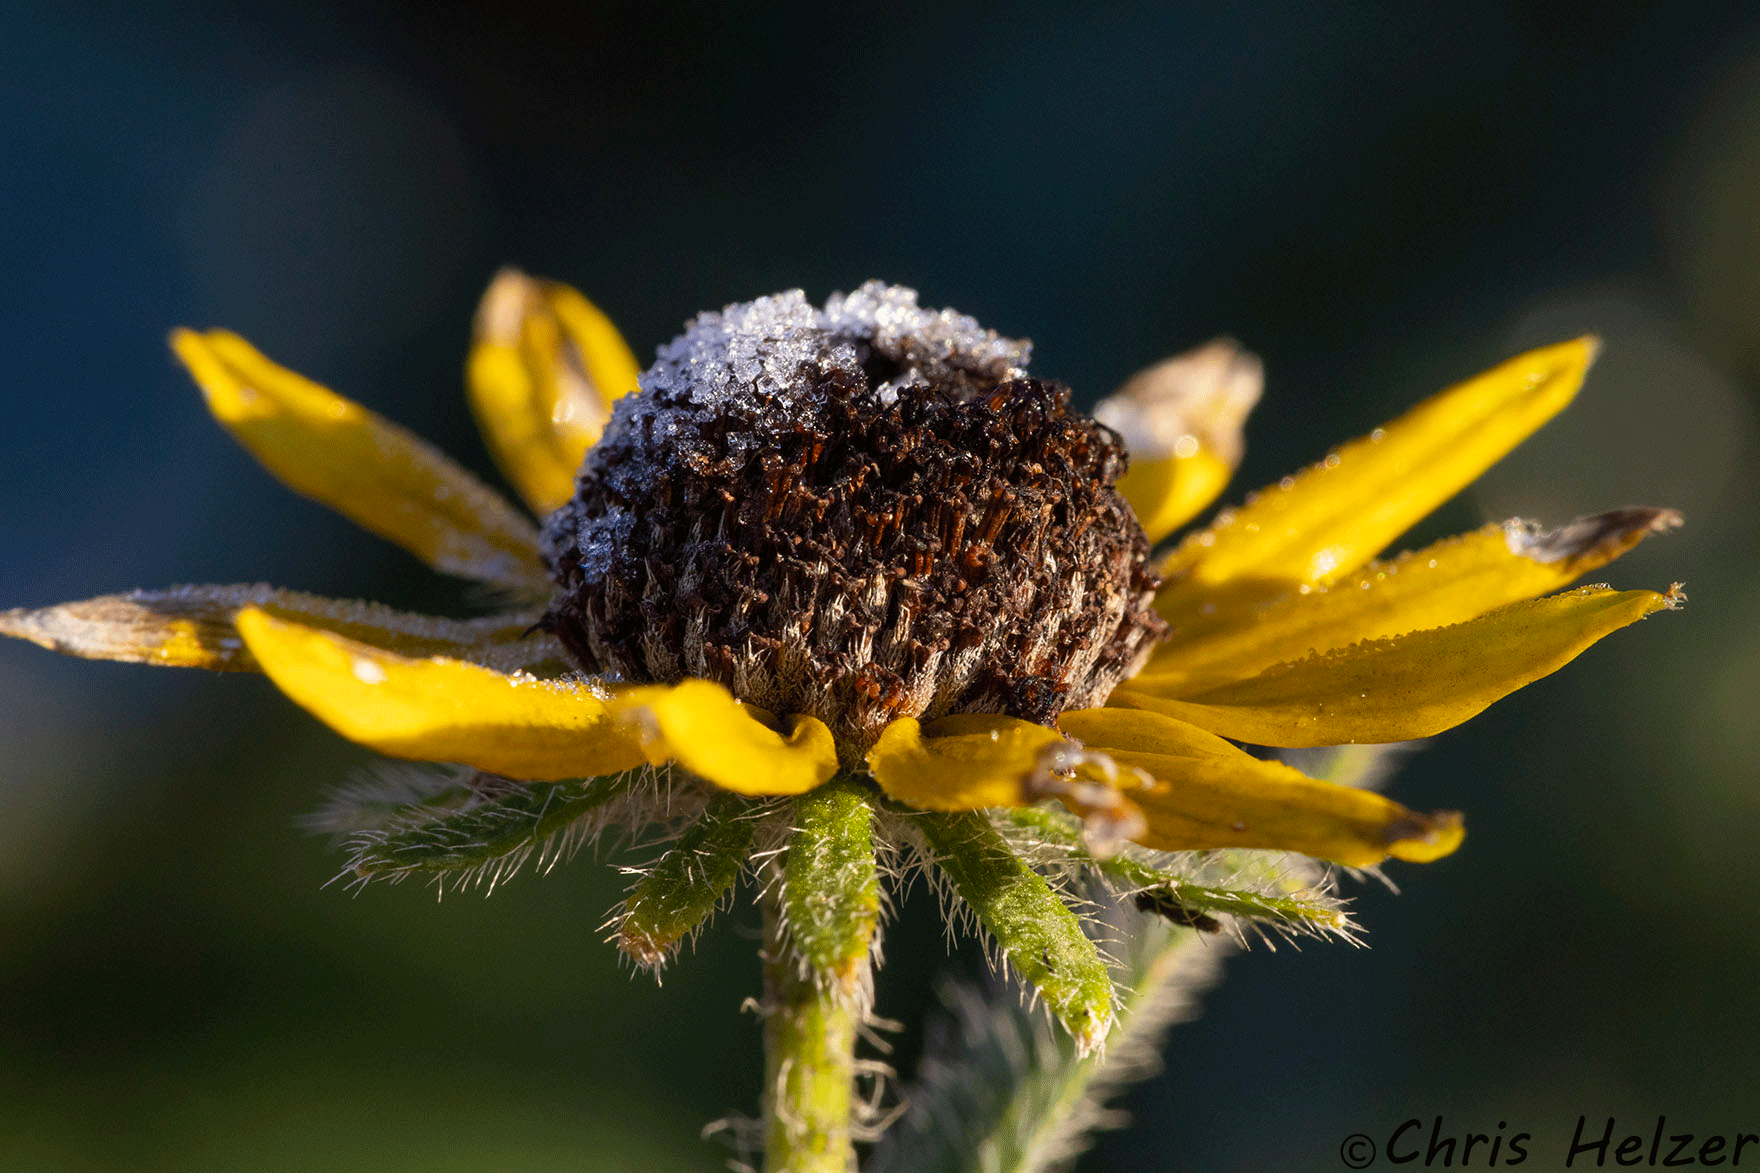
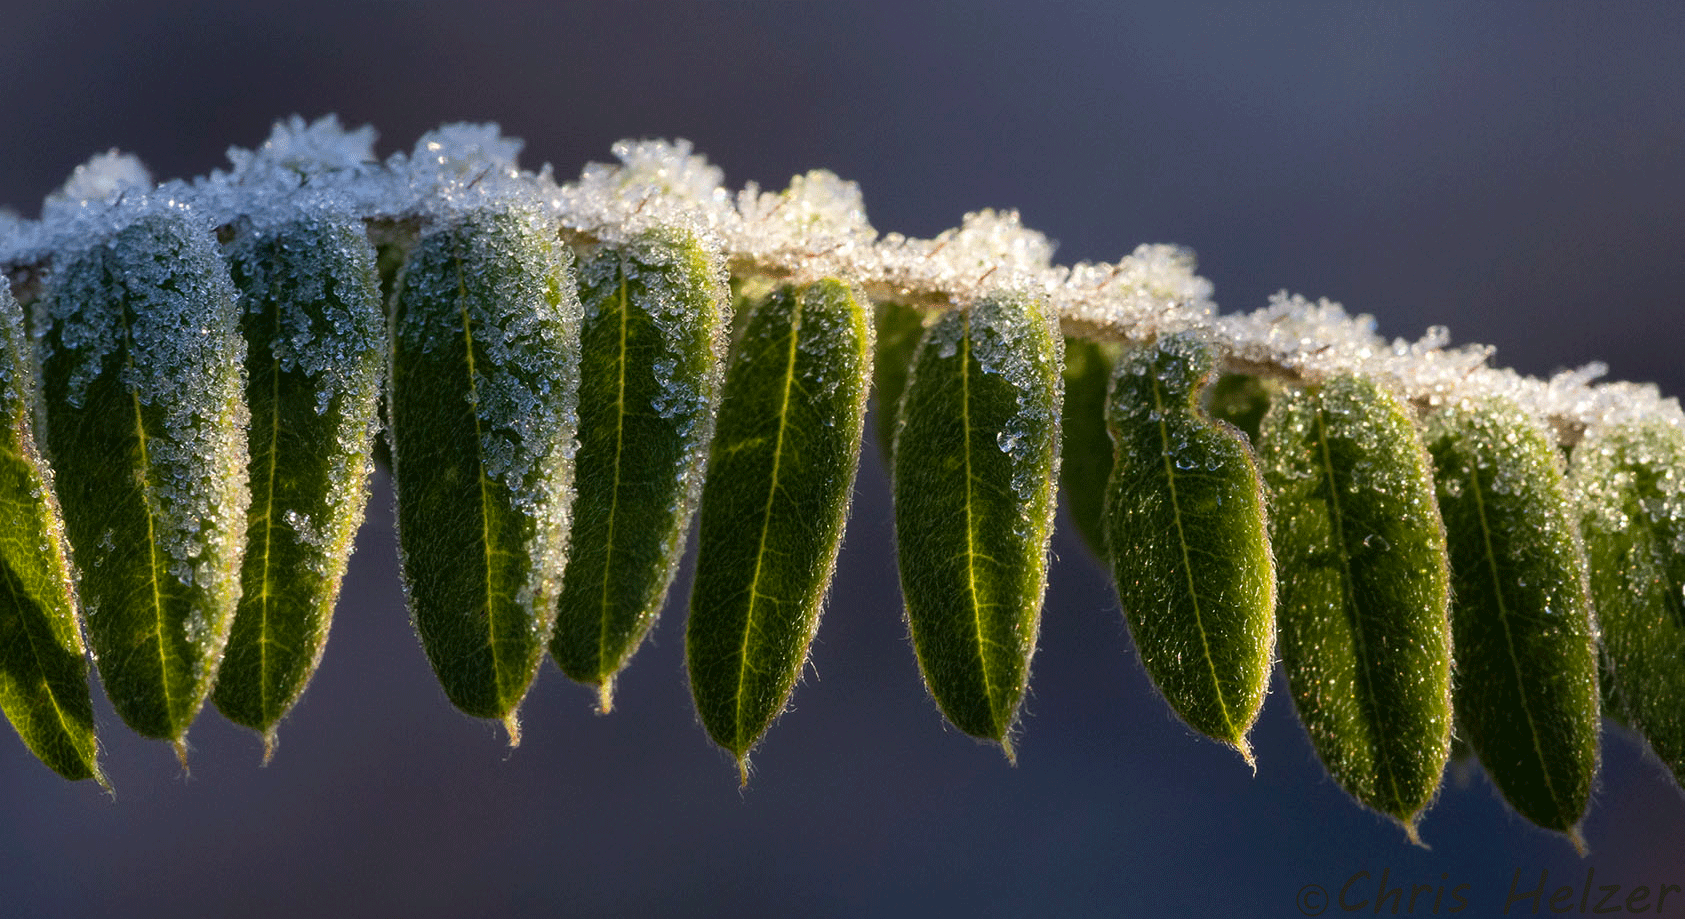
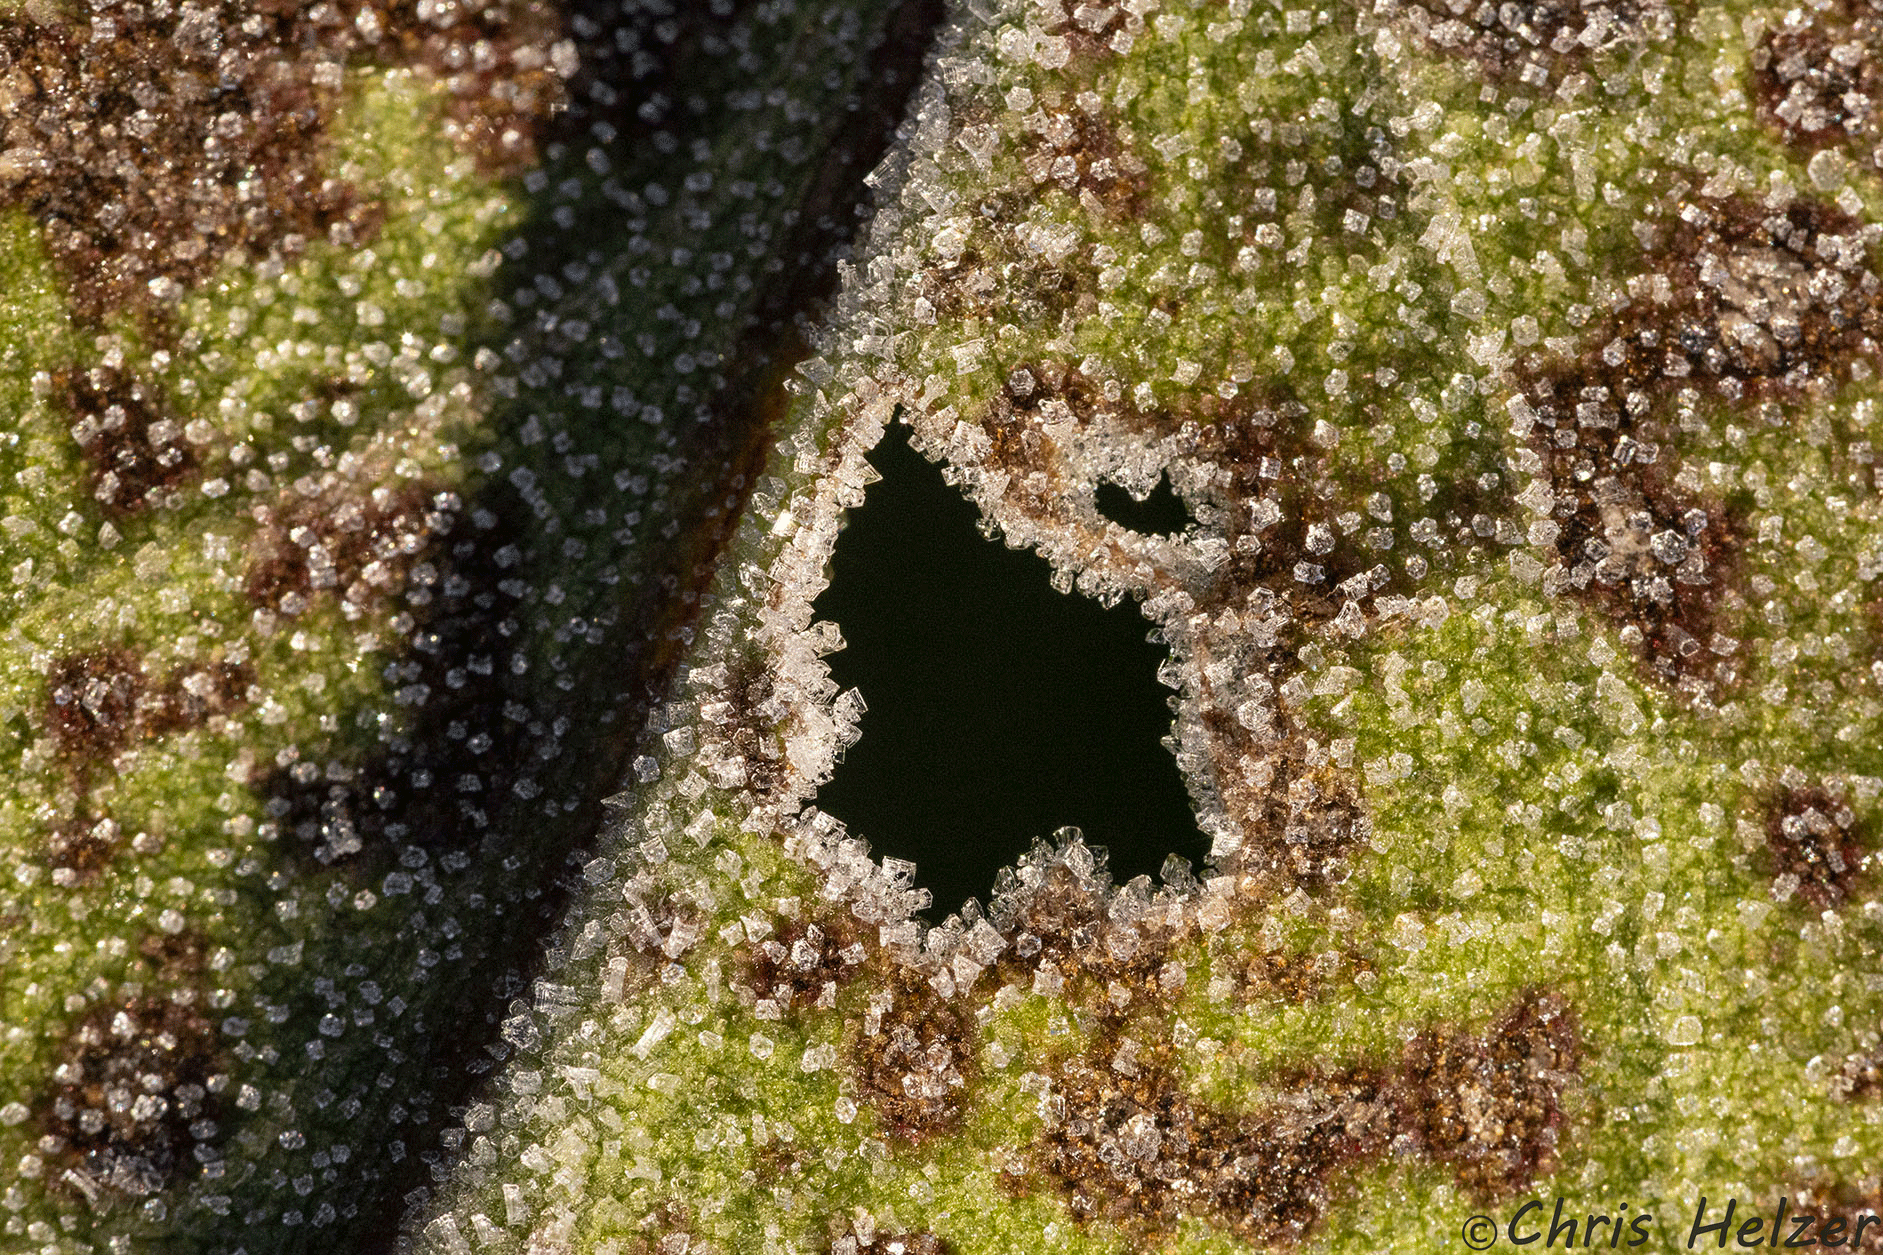
The morning after I returned from some warm sunny days in Kentucky, we had our first frost of the season here at home. I stole a few minutes in my backyard prairie garden and captured a few shots of the frost before the sun burned it off.
Bergamot and frostStiff goldenrod leafWild bergamot flowerBlack-eyed SusanLeadplant leafThe same stiff goldenrod leaf as above as the sunlight was getting almost too intense to work with
I hope you’re having a great October so far. There’s a lot happening in the world, but if you’re like me, a little time in the prairie can make it all a little easier to handle. Be well, friends.
Public Service Announcement: There are lots of good ways to restore and manage prairies for biodiversity, wildlife habitat, livestock productivity, or other objectives. Beware anyone who says otherwise.
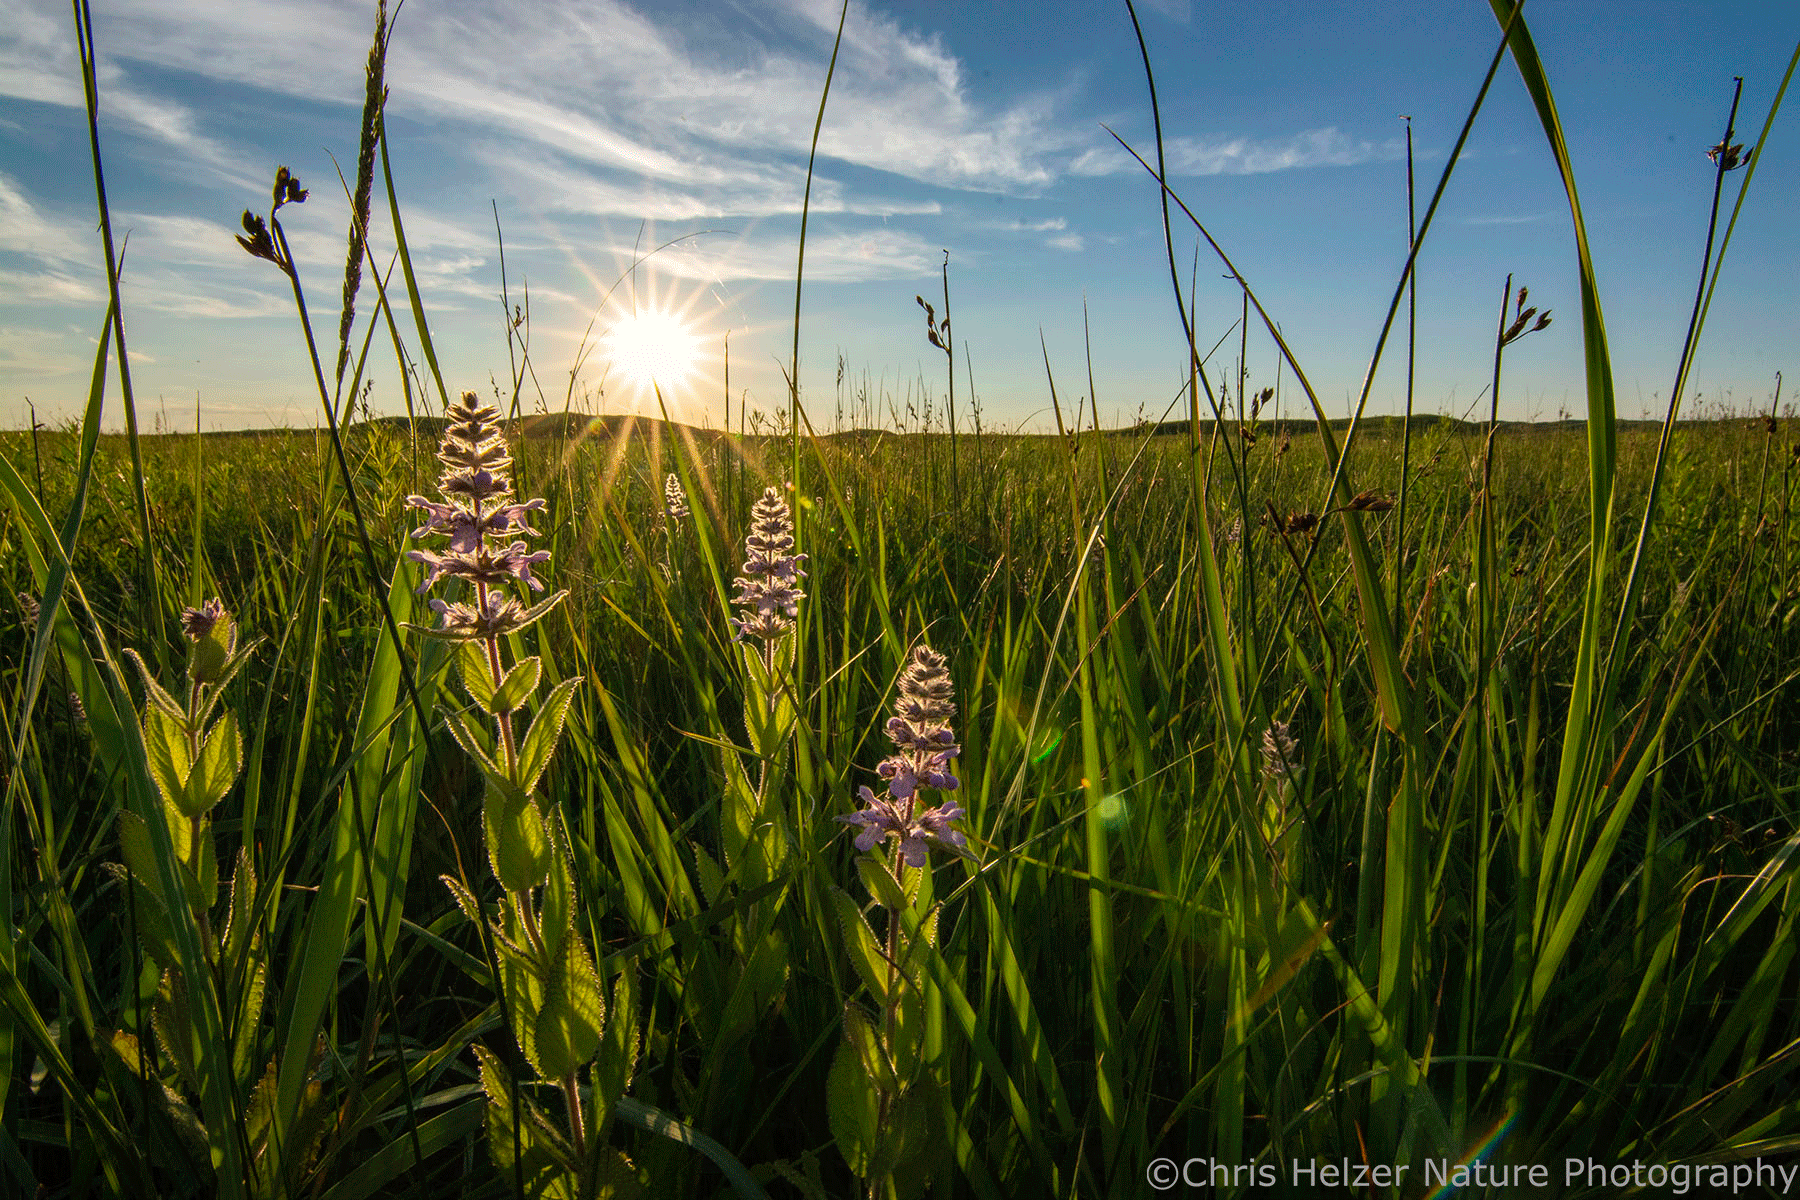
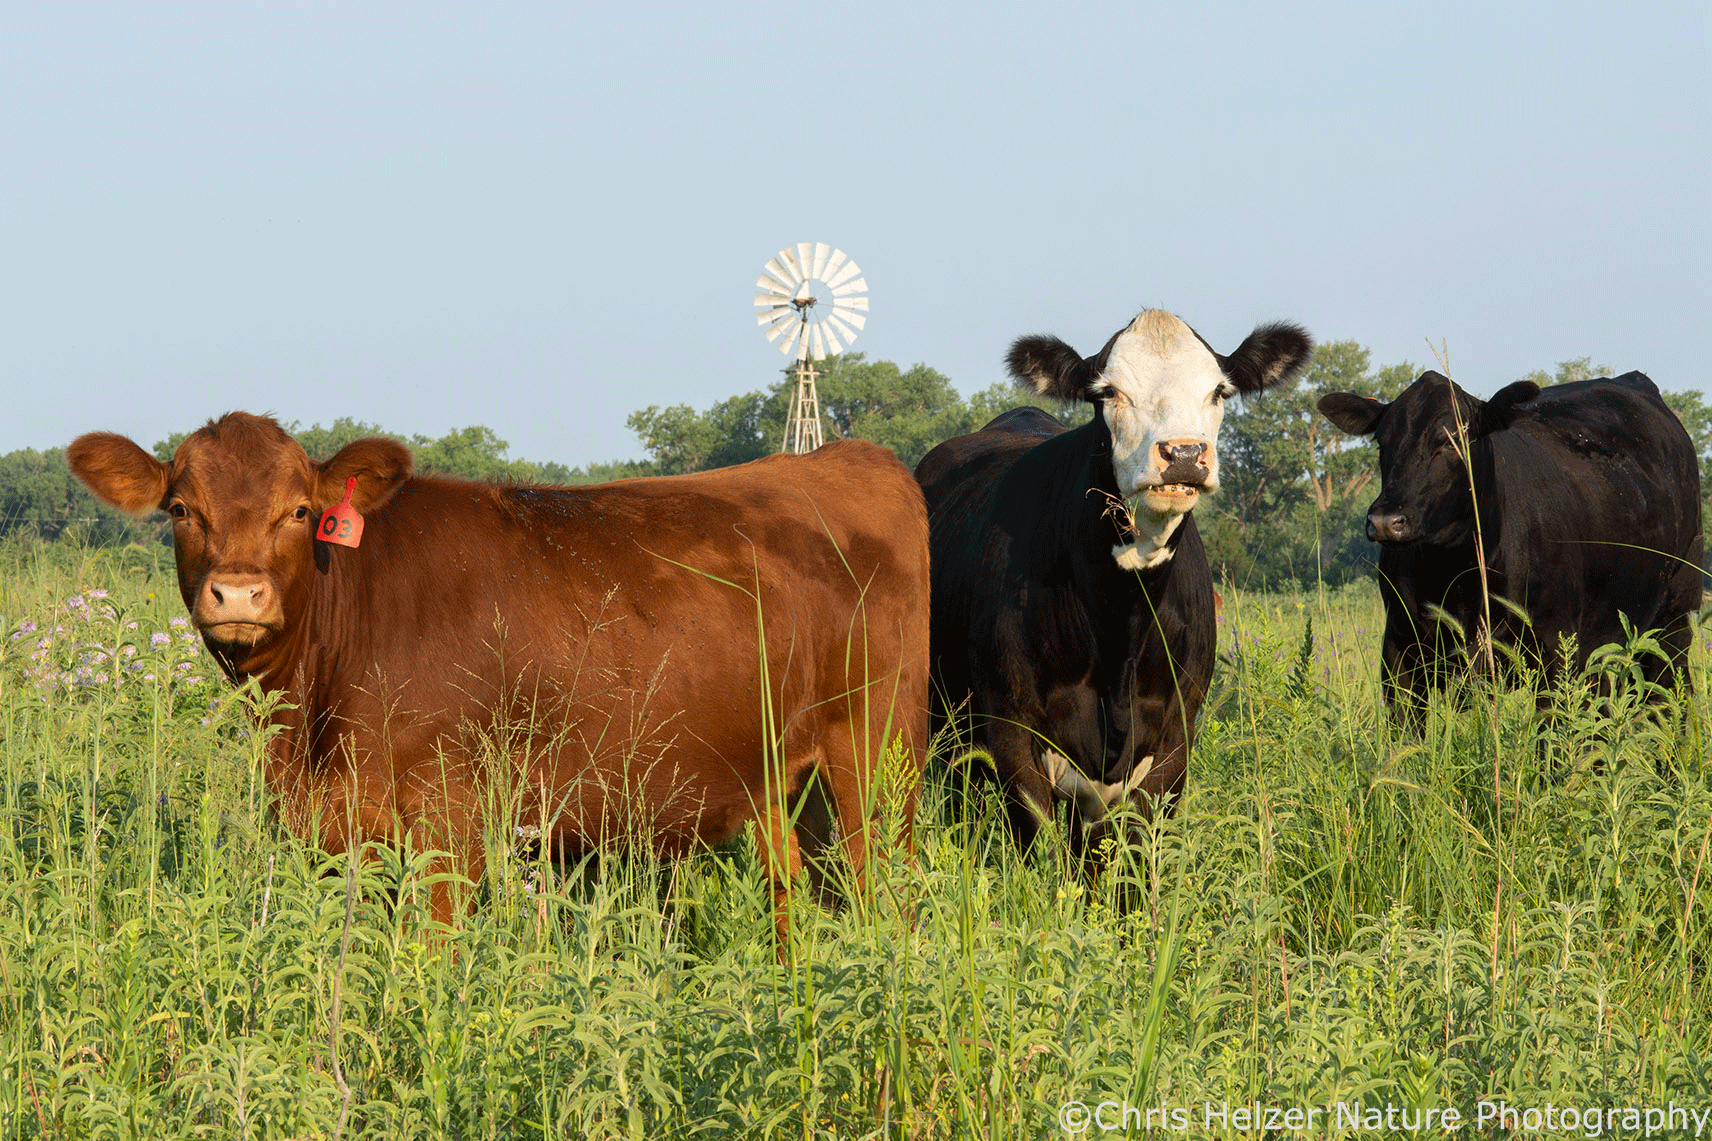
Prairies can be managed in many different ways and maintain their resilience, diversity, and beauty.
You’ve likely come across people, either in person or online, who confidently proclaim that they know the best way to manage land. Often, their proclamation is accompanied by derogatory remarks about people who choose not to follow their recipe. It’s very frustrating. It’s also dangerous because people with loud, assertive voices can be very convincing to people looking for advice or exploring ideas. If you follow current events, you may have noticed this phenomenon in other contexts besides just land management.
Anyone who tells you they know the best or only good way to do something is usually trying to sell you something, trying to get you to join their cult, or is delusional and/or misinformed. In fact, all those may apply simultaneously.
In terms of grassland stewardship, I often see this sort of blanket statement made with regard to fire or grazing strategies, prairie restoration/reconstruction techniques, or invasive species management approaches.
“Your prairie planting will absolutely fail if you don’t mow weeds twice during the first field season.”
“Only my particular herbicide recipe and approach will control that invasive plant.”
And so on.
As someone who is frequently asked for advice and sometimes gives it unsolicited, I try hard not to make those kinds of statements. There are many times I’ve talked about strategies we’ve had good luck with, or the reasons we are adopting or testing a particular approach. I hope I’ve always couched those statements in ways that don’t make it sound like our way is the only or best way to do things. I’ve definitely gotten better at it as I’ve gotten older and more experienced, continuously learning how complicated prairies really are. Please call me out if I don’t follow my own guidelines.
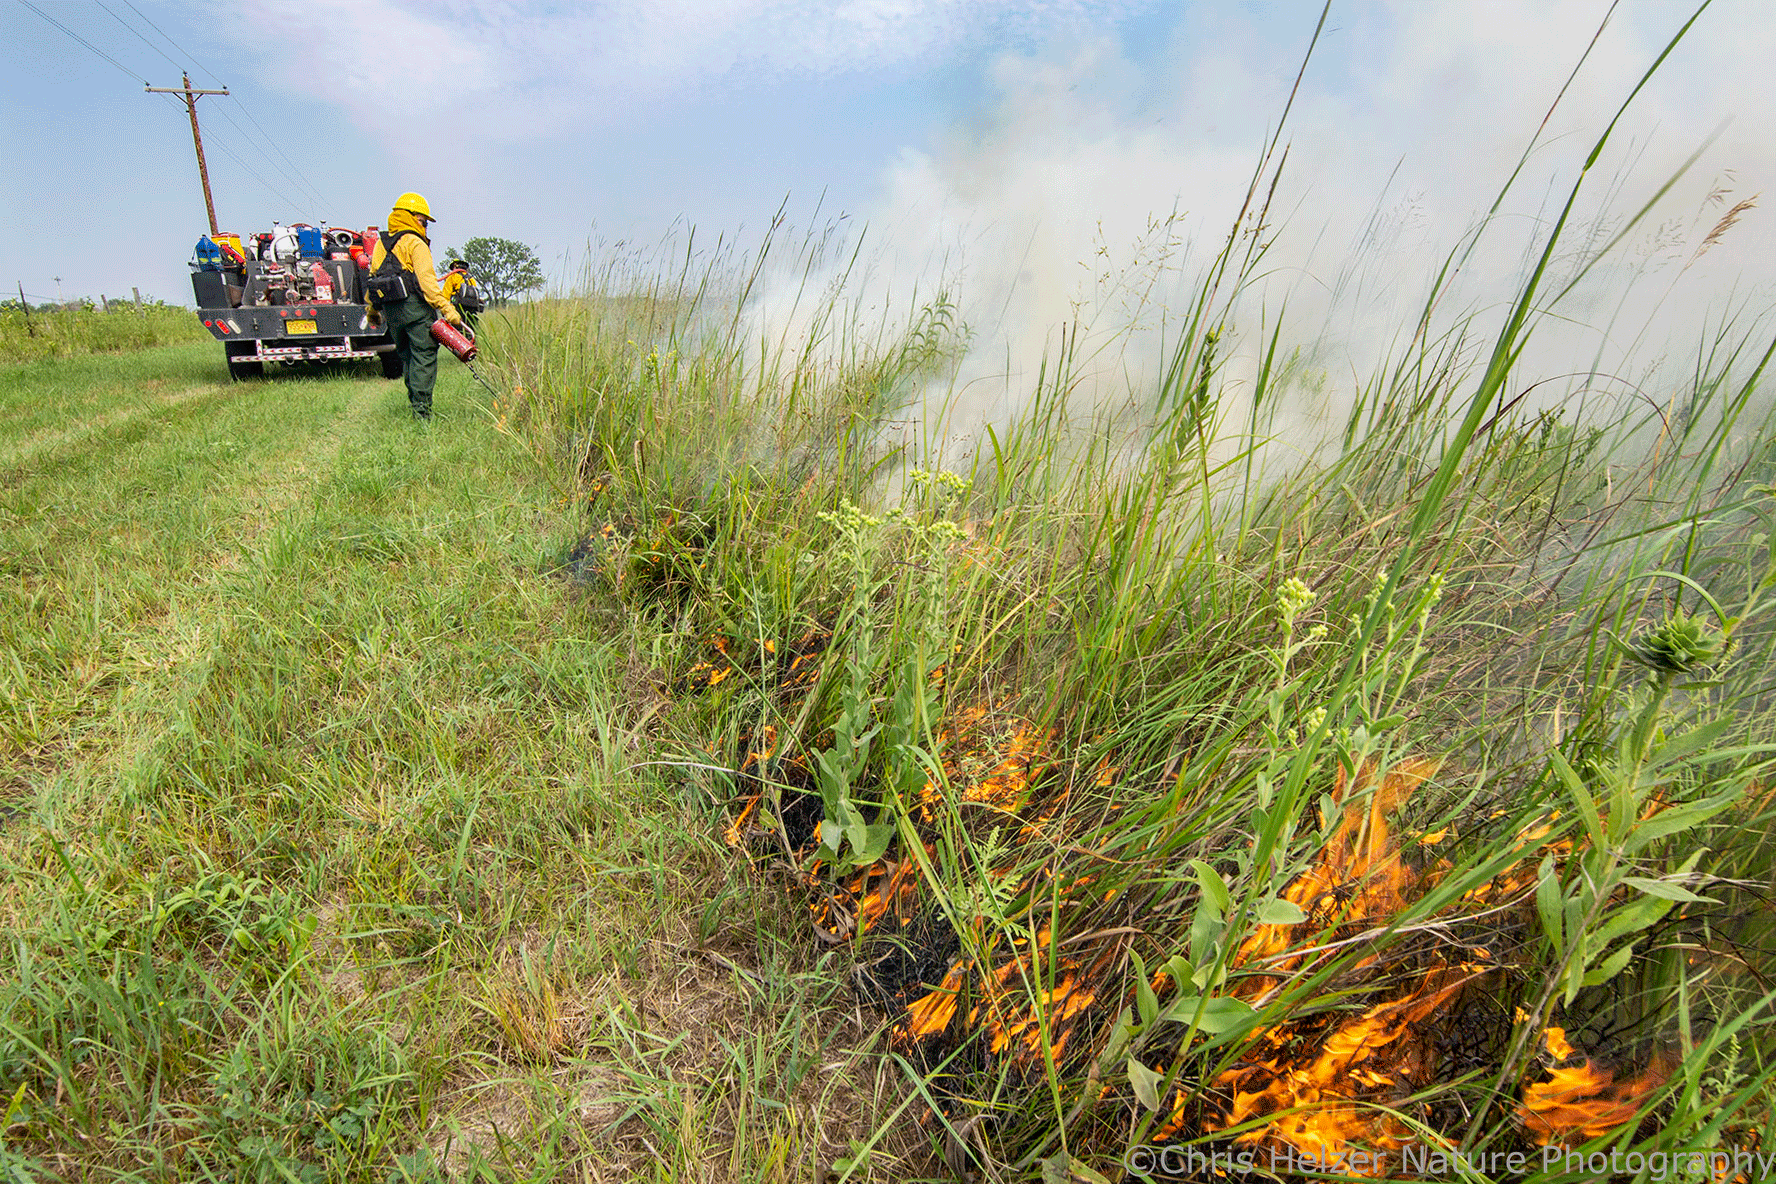
Summer fires can produce very different results from spring or winter fires, but those results can vary widely between sites. They can also vary between years at the same site. Prairies are complicated.There are definitely ways cattle grazing can degrade the health of prairies but there are also many different ways cattle grazing can increase or sustain plant diversity, soil health, and wildlife habitat.
There are obviously some wrong ways to manage prairies, but you’ve got to get pretty drastic before I’d toss you in that category. Spraying an entire prairie with a broad spectrum herbicide might be one example. Plowing the prairie and planting soybeans might be another. Short of those, I would hesitate to automatically characterize many actions as wrong or catastrophic. I might express some serious concern, or raise some issues to consider, but who am I to tell you what’s right or wrong in your situation?
Experienced land managers know it takes a lot of trial and error and close observation of results to find effective management or restoration strategies at a particular site. It takes multiple points of evidence to see a pattern. Even then, most of us are frequently surprised by the results of a treatment, even if we’ve used it many times before. Individual results may vary, etc.
There are lots of reasons that what works at one place might work differently for you. Sites vary in soil type, topography, plant and animal composition, past management history and size, just to name a few. In addition, the surrounding landscape has a huge impact on what happens within a site. Is the site adjacent to land with lots of trees, shrubs, or invasive plants crawling over the boundary? Is it ensconced within a matrix of cropland where it could be difficult for most animal species to repopulate your site if they are locally extirpated? Or are you fortunate enough to be in a landscape with lots of other prairie habitat around?
In addition, objectives can vary between sites. You might have a very different vision of what you want your prairie to look like than the person trying to sell you their particular brand of snake oil. (Tangentially, you never see snake oil on the market anymore, do you? The world has sure changed, huh?) Anyway, the point is that you might be aiming for different outcomes than the person giving you advice.
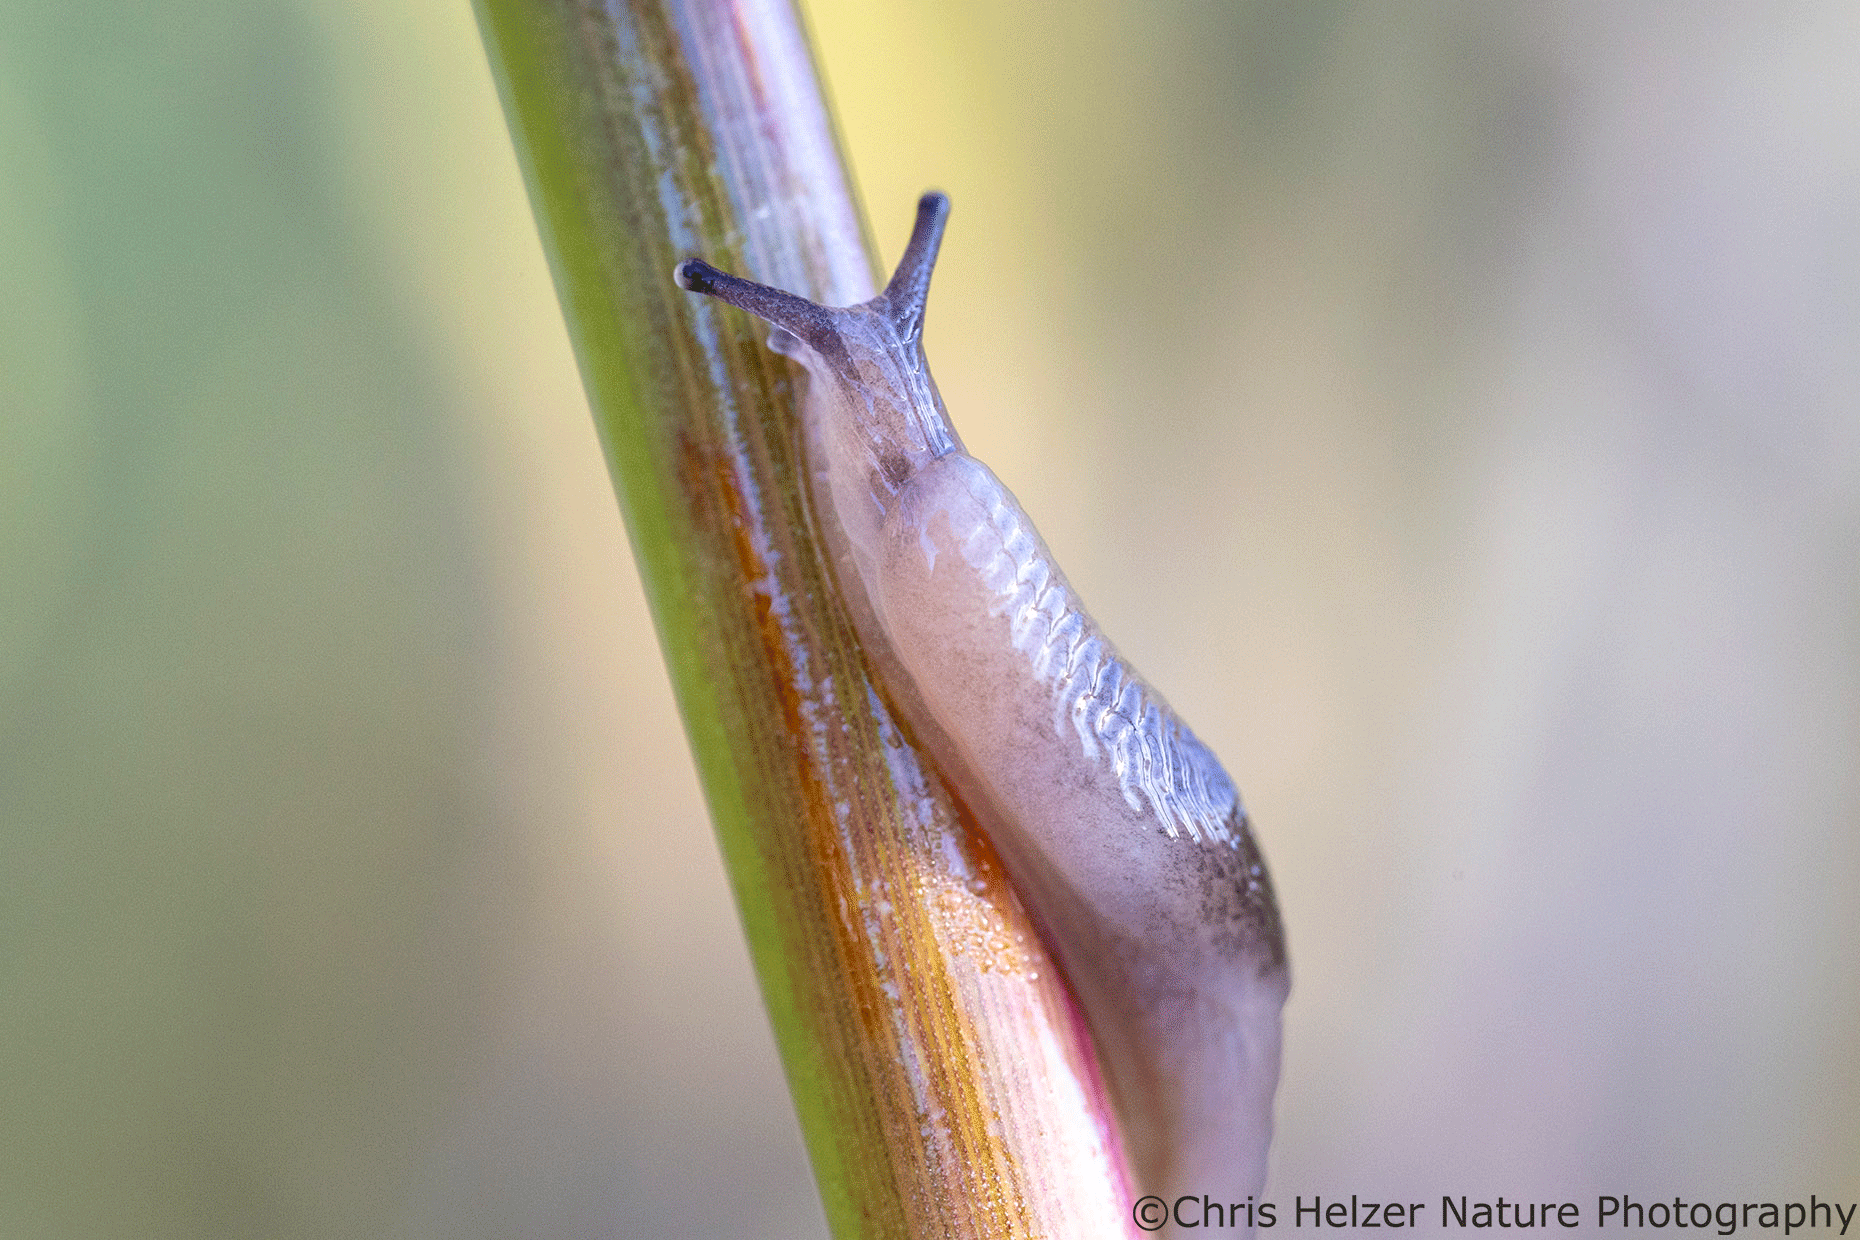
For example, you might have a particular bird, wildflower species, or insect that you really care about and/or that is rare elsewhere. If so, you might want to tailor your management to make sure you meet the needs of that species. Alternatively, you might have an affinity for pollinators, song birds, or slugs (no judgement), any of which might affect how you decide to manage and evaluate the results. If you’re a livestock producer, you likely have strong opinions or needs related to weaning weights, calving dates, marketing strategies, labor availability, and/or many other factors.
I don’t think I’ve yet met someone who is catering their prairie management around slug habitat needs but I bet I’ll enjoy talking to that person if I ever do meet them.
The people giving you advice almost surely don’t share all your precise objectives or limitations. Because of that, feel free to experiment. It’s always a good idea to talk to experienced people, both locally and otherwise, to learn what others are doing and what has and hasn’t worked at their places. That’s a great way to get ideas that can help you solve a challenge you’re facing, or to consider something you’d previously ignored. But you absolutely shouldn’t feel obligated to simply copy and paste their approaches. In fact, I’d encourage you not to.
If you have an idea you think might be risky, don’t dismiss it out of hand. Just experiment with it on a small part of your site before you scale it up. It’s no different than testing a new wood stain in an inconspicuous area or trying out a new hair dye on your little brother or sister before applying it to your own head. Please don’t be afraid to try new ideas though – it’s how we learn.
Most importantly, be a good observer. Pay attention to what happens after each restoration or management action. Learn as much as you can about different species and groups of plants, animals, fungi, etc., so you can better evaluate habitat and treatments through their eyes. Read, listen to, and talk to experts coming from lots of perspectives and ask hard questions. Then adapt, adjust, and tweak your strategies every year based on what you see and learn.
If you do this well, you’ll probably enjoy land stewardship and keep improving your expertise and abilities, though you’ll almost surely never feel like you’ve got everything figured out. This is a good thing. It’ll keep you humble and hungry to keep learning. If you’re lucky, it might also prevent you from starting a cult or trying to hoodwink people into joining it. Thank you in advance for that.