Much of what determines the outcome of prairie management treatments is out of our control. Sure, we can decide when to burn a prairie or set the timing and stocking rate for grazing treatments, but cascades of interactions between countless factors such as weather, insect population cycles, and many others can easily overwhelm any decisions we make. Over the holiday season, I found time to analyze some plant community data for one of our Platte River Prairies. The results provide a thought-provoking look at the unpredictable ways prairies respond to management.
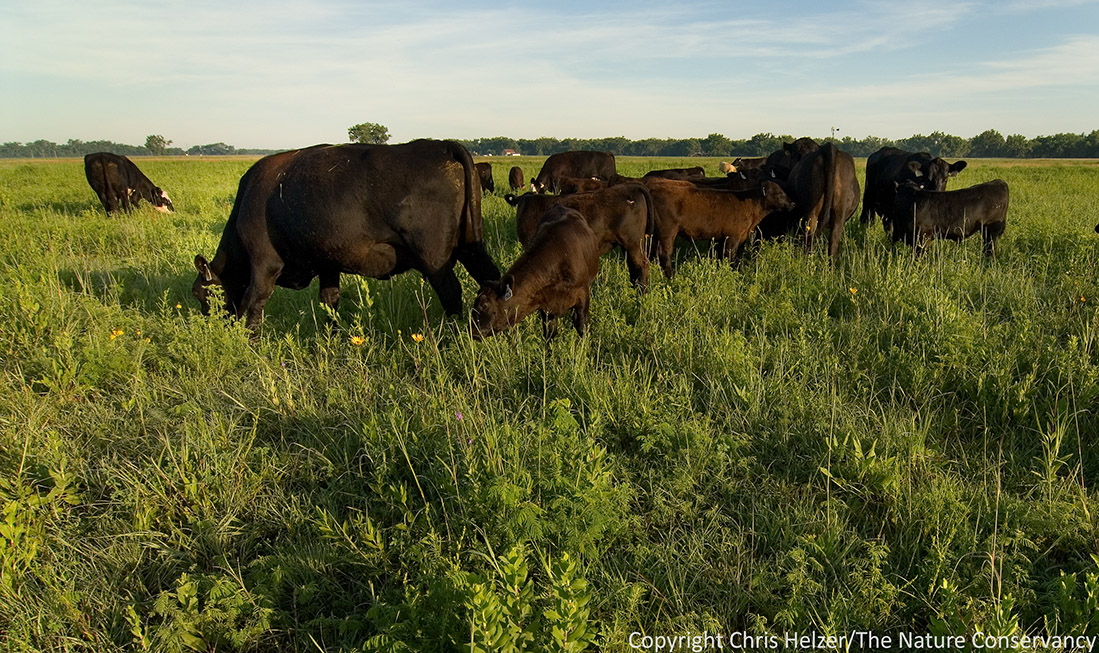
The results of grazing treatments are always a little unpredictable because while they tend to follow certain patterns, cattle can still make their own decisions about what to graze and what not to. However, variability in management results goes much beyond just the way cattle choose to act in a certain year. Burning, haying, and other management treatments can also have very different results from year to year. High-diversity restored prairie – The Nature Conservancy’s Platte River Prairies, Nebraska.
The following data are from a prairie that was managed with variant of patch-burn grazing, in which a different portion of the prairie was burned each year (in the spring) and cattle had access to both burned and unburned portions of the prairie during most of the growing season. As typically happens, cattle grazed the most recently burned patch pretty heavily and lightly grazed the remainder of the pasture. Details about the fire and grazing treatments can be found at the end of this post.
If you look at the two graphs below, you can see that there was a significant increase in the average number of plant species (species richness) per square meter between 2012 and 2013 in the portion of prairie that was burned in 2012. There was no significant change in species density in the unburned areas of the prairie – which were also grazed, but much less intensively. Data were collected during June in both years.
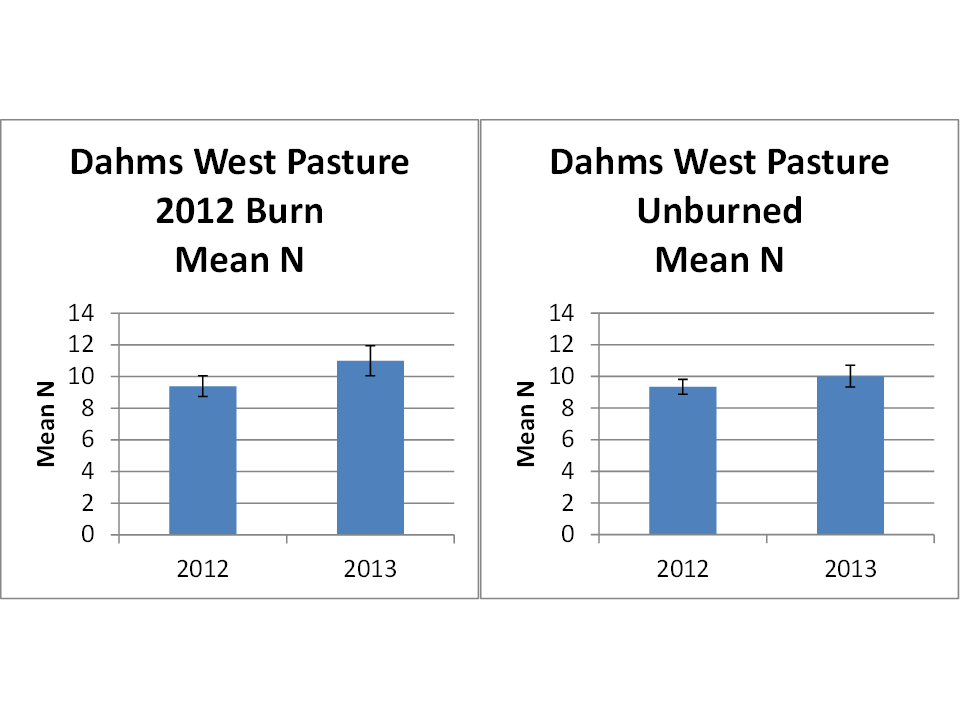
Two graphs showing the average number (Mean N) of plant species per square meter in one of our Platte River Prairies. The left graph shows an increase from about 9 spp/m to 11 spp/m in a patch of prairie burned in 2012, and the right graph shows data from the remainder of the prairie, which was not burned in either 2012 or 2013 and had about the same species richness/meter in both years. The entire site was grazed in both years, with the 2012 burned patch getting much more intensive grazing than the unburned areas. The error bars show 95% confidence intervals.
We see this pattern of higher species richness after fire/grazing treatments over and over in our prairies. My explanation of the phenomenon is two-fold, and was covered in more detail in a previous post. First, the burn exposes soil (and seeds) to light, allowing relatively high germination rates of seeds waiting for an opportunity. Second, the concentrated heavy grazing in those burned areas weakens the dominant grasses, prolonging the light exposure of the soil/seeds and also reducing the root masses of those grazed grasses, thereby opening up space belowground for new plants to gain a foothold. Those new plants start both from seed germination and from the rhizomes and buds of existing perennial plants.
The color-coded table below shows some species-level data from the same site that help explain the above graphs. The numbers indicate the frequency of occurrence (the percentage of sample plots each species was found in) each year. Some plant species appear to have responded positively or negatively to the burn and subsequent grazing intensity, while others seem unaffected by those management treatments.
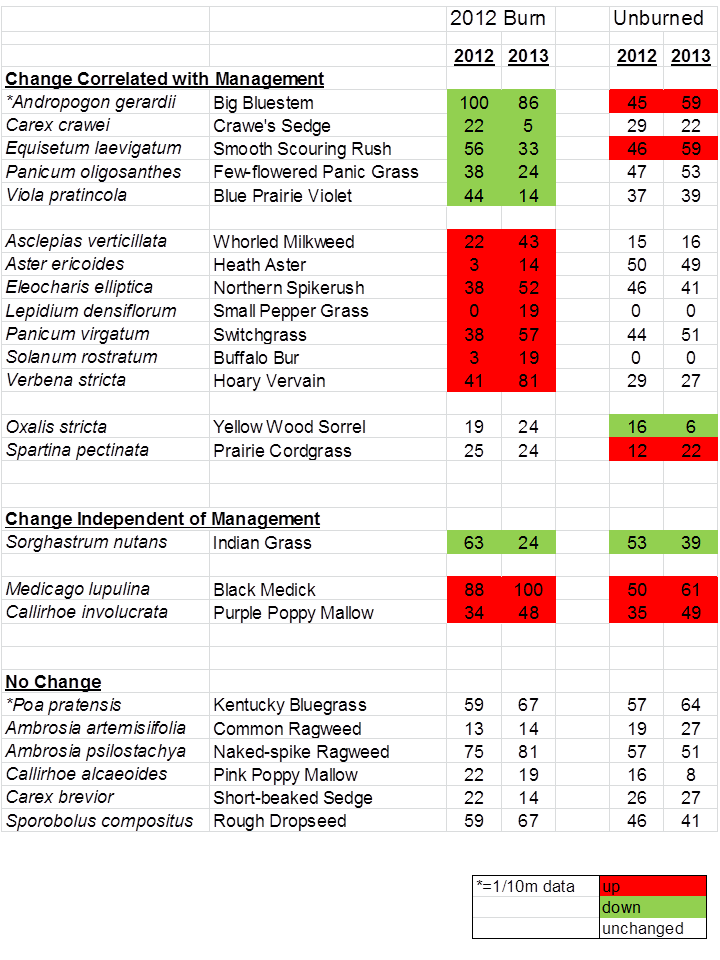
Plant species frequency (% of occurrence within sample plots) between 2012 and 2013 in a portion of the prairie that was burned in 2012 and the remainder of the prairie that was not burned. The entire prairie was exposed to livestock grazing in both years. An * indicates species with particularly high abundance, for which frequency is shown at the 1/10 m scale. The remainder of the data are from 1 m square plots.
So far, so easy. Fire and grazing are having positive effects on the vigor and occurrence of some species, negative effects on others, and no effect on still others. Cumulatively, the effects add up to an increase in the number of plant species per square meter in the year following the burn. Simple and clean. The next two graphs (below) seem to fit the same pattern, showing similar increases in small-scale species richness in burned patches back in 2007 and 2008, respectively.
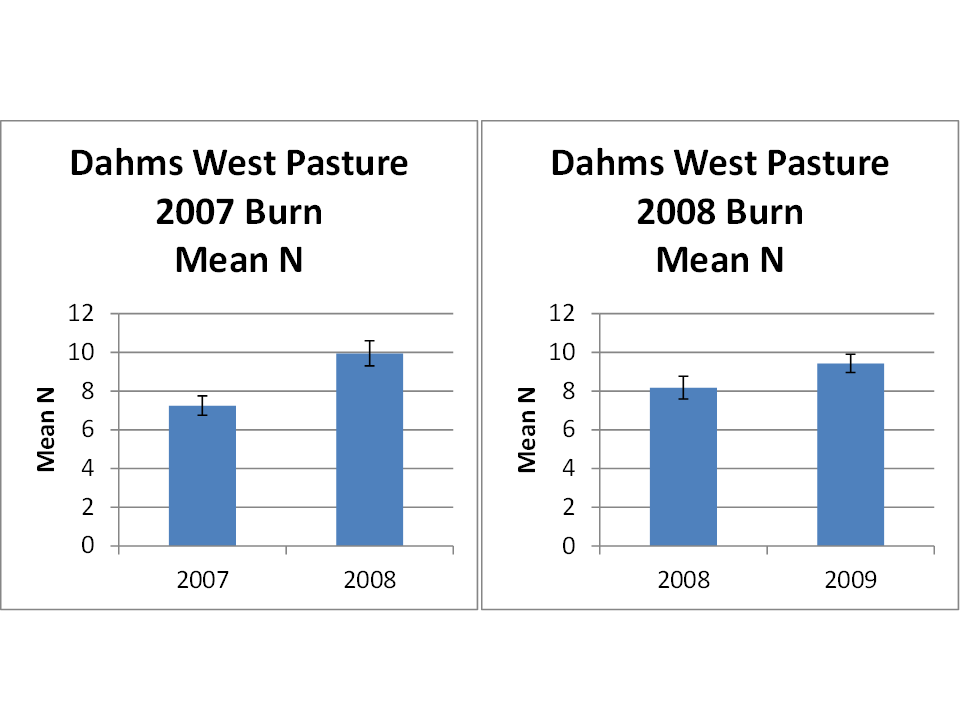
Two more graphs, showing results from burned patches from 2007 and 2008, respectively, and an increase in the number of plant species per square meter in the year following each burn. Again, cattle grazing was much more intensive in these burned patches than in the unburned remainder of the prairie each year. Error bars indicate 95% confidence intervals.
Here’s where it gets interesting… The next table (below) shows how individual plant species responded within the three burn patches (2007, 2008, and 2012) between the year of the burn and the subsequent year. Of the 29 most abundant species, only THREE showed the same response to fire/grazing in each of the three years, and another two were consistent in that they didn’t appear to respond at all to management in any of the three years. The remaining 24 species were inconsistent in their responses – some wildly so. Look, for example at indiangrass (Sorghastrum nutans), rough dropseed – aka tall dropseed – (Sporobolus compositus), and blue prairie violet (Viola pratincola, aka Viola sororia). Each of those three species showed a strong increase in frequency of occurrence in the burn patch one year, but a strong decrease in another.
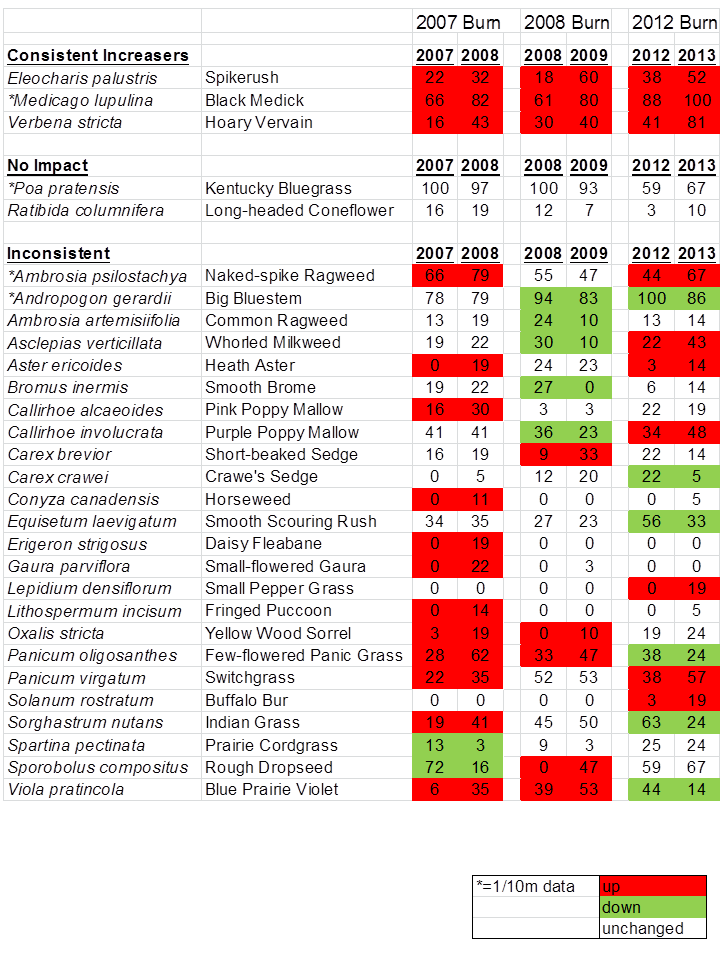
Plant species frequency (% of occurrence within sample plots) between the year of burn and the subsequent year in prairie patches burned in 2007, 2008, and 2012. The entire prairie was grazed in each of the years, with higher grazing intensity in the more recently burned patches. An * indicates species for which the frequency is shown at the 1/10 m scale – the remainder of the data are from 1 m square plots.
So what are we to make of all this? How can we manage prairies effectively if the impacts of very similar management treatments are so different from year to year?
As far as the first question, it’s clear that other variables – particularly weather – interact strongly with management treatments to influence the response of plant species. Every species has a different optimum range of temperature and moisture conditions, so the timing and intensity of rains and warm/cool spells affects the competitive balance between species differently each season. Many other factors and interactions are also in play. Year-to-year changes in population size of various seed-eating species can influence the seed bank, for example. In addition, the success of a particular plant species in one year catalyzes or suppresses other species (plant, insect, mammal, etc.) in the following year. All of those interactions are signs of healthy prairies, but make it very difficult to predict how those prairies will respond to our management.
As to the question of how we’re supposed to manage prairies in light of all this variability, there are at least two ways to respond. The first is to throw our hands up in disgust because we can’t seem to predict results well enough to make useful decisions. The second option is to relax, embrace the variability, and roll with it.
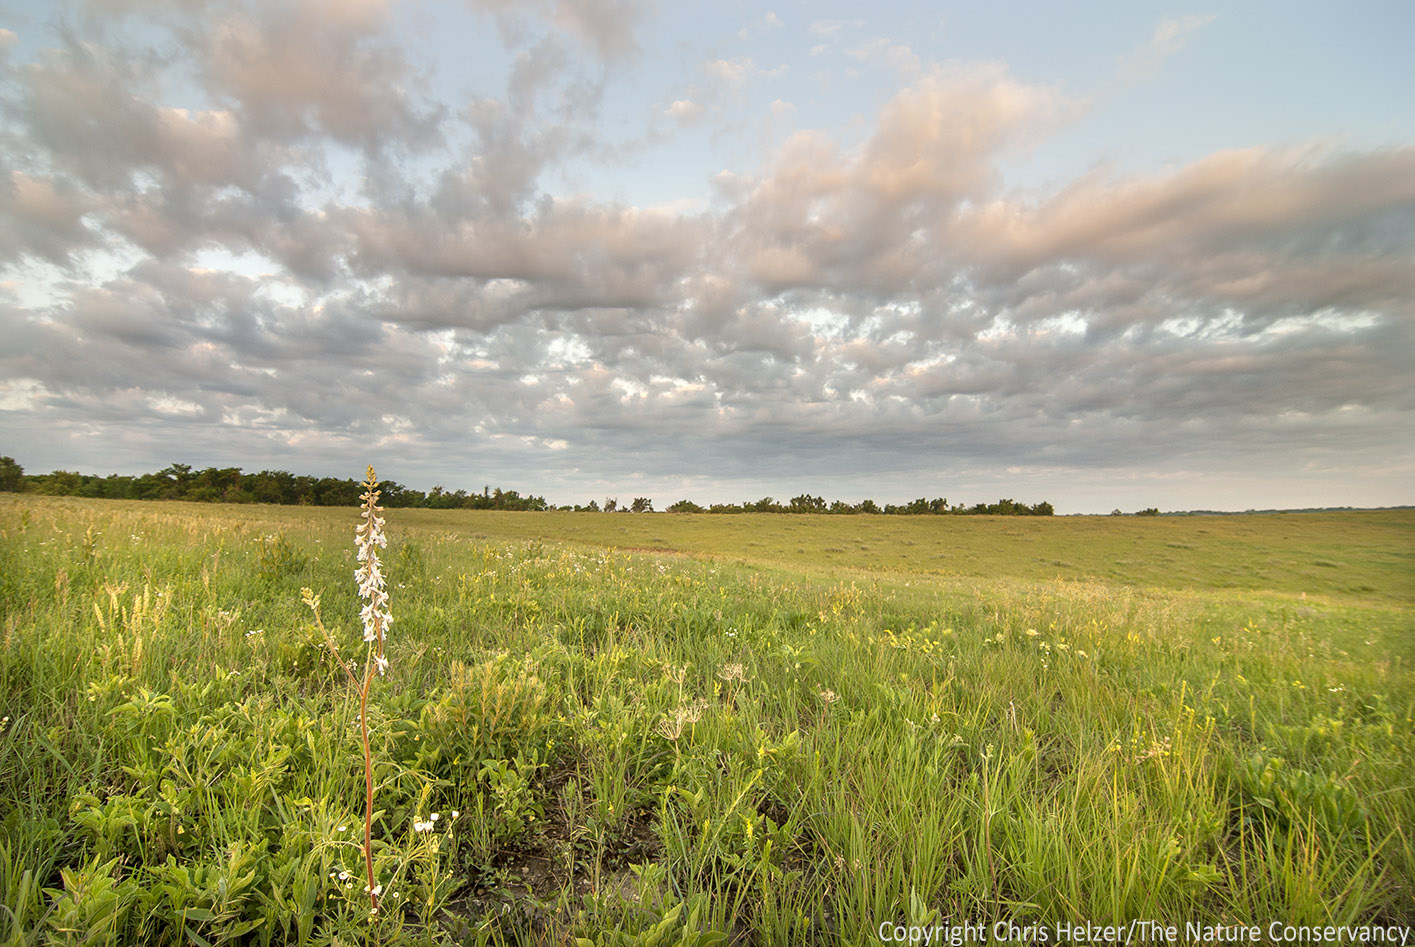
Healthy prairies have a great diversity of plant and animal species, but also a great diversity of responses to year-to-year stresses imposed by both managers and the environment. Tallgrass prairie in Richardson County, Nebraska.
Our human nature makes us want (need?) control over our environment. In agriculture, landscape architecture, engineering and many other fields, the objective is to manipulate the world to our benefit – often by reducing the variables and controlling the remaining ones. However, when managing ecosystems in order to conserve the diversity of species and their functional roles, that approach simply doesn’t fit. Instead,we need to think differently about both short-term objectives and long-term goals.
To help me deal with unpredictability, I tend to consider prairie management objectives in terms of ecological resilience, rather than in terms of desired responses from particular species. (See this earlier post on ecological resilience for background.) I think of a prairie as a ball in a bowl. The bowl represents a range of conditions, within which the prairie (the ball) maintains its integrity as a prairie – even if it rolls around quite a bit. Some disturbances, such as plowing or broadcast herbicide can quickly push a prairie out of its bowl and into another state, from which it is tremendously difficult to recover. Other disturbances, such as drought, tree encroachment, or intensive grazing may push the ball toward the edge, but as long as those disturbances don’t continue for too many years in a row, the ball doesn’t leave the bowl.
My management objective is not to prevent the metaphorical ball from moving, or to push it toward some optimal part of the bowl. Rather, I have two big objectives:
1.) Make sure the ball can move freely around the bowl in response to disturbances, but nudge it back from the edge when necessary. I celebrate the fact that our Platte River Prairies change in appearance from year to year. That tells me they are rolling around that bowl as they need to do. In order to prevent an exit from the bowl, I make sure that we’re suppressing tree encroachment before a prairie becomes a woodland, and that we’re avoiding the kind of chronic intensive grazing that can push some prairie species to local extinction. During extended droughts, we modify our management to avoid imposing too much additional stress on prairie communities.
2.) Keep the bowl as large as possible by maintaining a high diversity of prairie species, along with the functional roles each contributes. That diversity of function allows the prairie to absorb stress and respond to adversity without leaving the bowl. Maintaining that diversity means manipulating the field of competition between prairie species so that every species can win now and then (by reproducing) and maintain itself within the community. We create an annual patchwork of various fire, grazing and rest treatments and shift the location of those patches from year to year to provide for the needs of as many plant and animal species as possible.
Prairies are dynamic, and thank goodness for that. Their ability to flex and respond to various stresses is a key characteristic that has allowed them to survive for thousands of years. As prairie managers, we need to facilitate that flexibility instead of becoming frustrated with our inability to predict how prairies will respond to our management. After all, our job is to keep prairies healthy, not turn them into something they’re not just to help ourselves feel more in control.
Management Details
For those of you who might be interested, here is some additional information about the management treatments applied to the prairie in the above example. The pasture the burns were conducted in is often grazed in conjunction with adjacent prairies, so the total grazed area varies in size from year to year. In each year, the overall management was patch-burn grazing, in which cattle had access to the entire grazing area, but did most of their grazing in the most recently burned patch. The stocking rate shown (AUMs/ac) is calculated for the entire pasture and entire season.
2007 Burn (North 1/2 burned on Apr 16, South 1/2 on May 2)
240 acres grazed overall in 2007. 27 pairs from 4/1 – 10/31 (Approx. 1 AUMs/ac)
2008 Burn (Burned on March 18)
171 acres grazed overall in 2008. 27 pairs from 4/1-5/20, 15 pairs till 9/15 (Approx. 0.7 AUMs/ac)
2012 Burn (Burned on March 30)
300 acres grazed overall in 2012. 75 pairs 4/20-Jun 1, 50 pairs till 10/1 (Approx. 1.3 AUMs/ac)

Chris,
Have you looked in the literature for data that show this high variability of response at the species level?
Thanks for posting the data!
Hi Adam, I have not gone digging. Maybe someone more familiar with the literature will know of a paper or two that would be good to see. Glad you enjoyed the post.
A really fascinating post that I’ll need to read again to make sure I understand it properly, but I love the science and the application to such beautiful habitats
Yes-prairies are like life- dont micro-manage and keep it messy. :) Good post Chris.
Hi Chris,
I didn’t see a burn/no graze treatment group in the data set. For example, does hoary vervain increase in response to fire alone? As a philosophical question, how easy would it be now to go back and test the prediction that species like hoary vervain would decline in you now remove grazing, but not burning, from the equation? Does depending on grazing for income now prevent you from trying experiments in which grazing is eliminated on large tracts for extended periods?
Patrick – excellent questions. You’re right that I didn’t have a fire only treatment. I didn’t actually set this up as a research project. It was more of an evaluation project to help me see what impacts our management was having. In the past, I’ve seen some hints that fire alone has at least some impacts. I did a small study that tracked purple prairie clover in permanent plots and watched populations ebb and flow with management. There was a good bump in prairie clover numbers the year after a burn/graze treatment, but – at least in some years – there was also a bump in the year after a burn only treatment. I think it’s likely that some species respond well to the availability of light and then can fight through the competition of nearby grasses while other species might germinate after a burn increases light availability but then fail to survive the competition from those grasses without some grazing to suppress them. Prairie clover might be one of those species that can handle grasses if it can just get the light it needs to start. I don’t know about hoary vervain for sure, but it’s not a strong competitor like prairie clover, so my guess is that you might not see the same bump in abundance with vervain in the year following a burn because it’s not a strong competitor with the grasses that will also thrive after a burn. I might go back and look at some exclosure data from other sites to see if I can glean anything from them.
To answer your last question – No, I’m not prevented from using fire exclusively because of income. We set our management plans completely independently of our budget process – something I feel very strongly about. We don’t do large tracts of burn only because I don’t like the effects of that as much as I do the combined effects of fire and grazing together. The relatively uniform habitat structure following a burn (with no grazing) is similar to that from haying (which we do get income from) and I don’t like either on large tracts. I think it’s important to have a variety of habitat structure types across large prairies, at least as much as possible. As I mentioned above, I do have some exclosures set up (a couple acres in size each) in which we are using fire and rest only, and they are not only uniform in habitat structure, they are also lower in plant diversity than our burned/grazed sites. That kind of result (the plant diversity result) is probably less likely to occur in more productive eastern tallgrass prairie soils, by the way.
I look at your data and I have trouble believing it. I have known individual plants for many years. I just can’t believe you are seeing so much variability from year to year. I have worked to propagate plants and it is slow going. It is hard for me to believe you seeing those increases. Are the new plants you are counting small seedlings?
James, I don’t know what to tell you. I see the results both observationally and through my data analysis. When I did the other study I mentioned in my reply to Patrick’s question (prairie clover in permanent plots) I was seeing a lot of new prairie clover seedlings around parent plants after burn/graze and burn only treatments, and a certain percentage (variable) of those would survive to the next year. Most of the species for which I saw big increases in this latest data set are opportunistic plant species that make a living taking advantage of weakened plant communities but aren’t great competitors with perennial grasses (hoary vervain, heath aster, peppergrass, wood sorrel, etc.). Others apparently found what they needed for growing conditions and took advantage of them, which seems like what plants should be able to do in order to maintain populations in prairies. I’m seeing those increases in the June following the year of the burn, and the plants I’m seeing are a combination of first-year plants (germinated the year after fire/grazing) and plants that are bigger and look like they probably germinated the year of the burn.
It would be interesting if you made a map of the individuals of each species in your plot denoting size. This type of analysis would allow an understanding of what was happening more than can occur from a simple count. You must be really good at identifying seedlings. I would have trouble distinguishing a number of your species in the seedling stage.
Chris,
I find heath aster to be a great competitor with grasses. In fact, I purposefully introduce it in very dense warm season grass plantings to help establish some plant diversity. There is a good white paper that quantifies this “Competition Between Forb and Grasses” by Don Dwyer.
David
James,
I think it may be a bit apples to oranges. The Chicago region, where you work, has some incredibly diverse prairies composed of very conservative species. Where as many of the species listed in Chris’s list are not conservative. As you know, species from the “Consistent Increasers” list like hoary vervain and black medic love disturbance and establish quickly. Hoary vervain is good for insects, and black medic is a foreign invader, but I doubt you spend any of your plant propagation time working with these species?
David
The species on Chris’ list that I am propagating is Lithospermum incisum. Chris has this plant increasing from zero to fourteen in his 2007/2008 data. This makes me question the method used and the usefulness of the result.
Yes, fringed puccoon is not a fast developing species and it is an increaser with fire. Fringe puccoon seedlings can resemble whorled milkweed seedlings. Maybe plants were lost in the thatch during non burn years? It is a good question?
Two things about the L. incisum question. First, the data that is least strong in my sampling were the smaller numbers, there would be more statistical error around the numbers in the 0-20 range than in the 50-70 range. But second, L. incisum is a very common plant in our prairies, especially in sites with a history of overgrazing. It also appears readily in our cropfield conversion seedings. I’ve had conversations with others in eastern prairies that make me think it acts pretty differently east to west. Maybe it’s on the fringe (ha) of its growing condition range in more productive eastern soils?
In the east, Lithosperum incisum is a species of dry prairies (usually thin soil) and hill prairies. This species tends to be restricted to the driest habitats which are typically distant from one another. These habitats are now islands, not just because of fragmentation, but also likely because the populations have retreated to the driest locations remaining as the climate became wetter. This likely explains why S&W gave this species a coefficient of conservation of eight. I have not had trouble growing it. It just does not germinate significantly until the second season. It would likely do well from seed in the appropriate habitat. However, it would likely take five years before blooming plants would be observed.
I like the bowl metaphor. It’s a lot like the metaphor used to describe annealing in metallurgy and simulated annealing in AI, which is something along the line that the crystalline structure of metal will tend to stick at a stable local minima that is greater than the global minimum. Applying energy (heat) can drive the metal out of this state, and allow it to settle into a lower local minima.
The big exception is that this is a good thing for metals, but bad for prairies. :/
Good post. I’m facing many of these issues as well..