Back in May of this year, I wrote about ecological resilience in prairies. In Part 2 of that double post, I gave an example of a 1995 prairie seeding and talked about how it appears to be maintaining its plant community integrity – through wet and dry years, fire, and grazing. Since that time, I’ve collected and analyzed more data from that same prairie seeding, and wanted to flesh out that earlier story.
With regard to prairie restoration, my objective is to use high-diversity seedings to expand and reconnect fragmented prairies and thus increase the viability of prairie species and communities. Because of that, I don’t measure success by whether a prairie seeding looks like any particular remnant prairie. Instead, I’m trying to establish as many native plant species as I can, let them sort themselves into communities that are adapted to today’s conditions, and use management techniques such as fire and grazing to maintain that plant diversity. I’m assuming that by providing that plant diversity, I’m also providing the habitat needed by the animals in adjacent remnant prairies, and that those animals will move into – and through – prairie seedings, thus increasing animal population size and viability. I’m beginning to test those assumptions, and will be ramping up that effort during the next several years.
In the meantime, I’ve been tracking the plant communities within our prairie seedings to look at how many plant species establish and maintain themselves. More importantly, I’m tracking the long-term trajectory of those plant communities using plotwise floristic quality analysis (you can read more about that technique here). If the prairie seedings are ecologically resilient, one measure of that resilience should be that populations of individual plant species, and overall species diversity, are stable over time – even through stress. The 1995 seeding, for which I’m presenting data here, is located in our Platte River Prairies, south of Wood River, Nebraska, and it has certainly undergone stress. Since it was hand-planted in 1995 by the Prairie Plains Resource Institute with approximately 120-150 plant species, it has seen both very wet years and a long severe drought (7 years), and has been managed with patch-burn grazing since 2002. Over the years, I’ve accumulated a total plant species list of 164 species for the 45 acre seeding, which I’m very pleased with. However, the real question is whether or not the seeding will be able to maintain its ecological integrity over time. Below is a series of photos and graphs that tell that story – at least the story up to this point.

This is what the 1995 seeding looked like in its 5th growing season. Species such as prairie clovers, perennial sunflowers, and other "matrix prairie plants" were abundant. Management to this point in time consisted of a couple of prescribed fires.
.

During the drought years between 1999 and 2006, there were times that the combination of intensive grazing and drought really stressed the plant community. This July photo shows warm-season grasses that have gone dormant, but also shows plant species such as rosinweed and prairie clover that were still green and growing - and largely ungrazed.
.

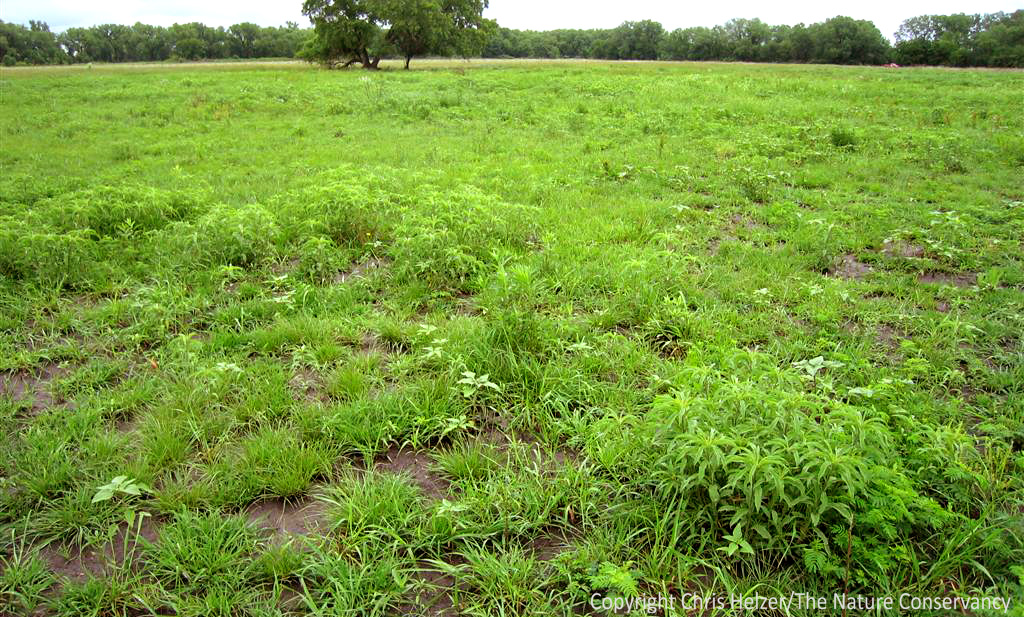
Within our patch-burn grazing system, a new portion of the prairie is burned each year, and intensive grazing tracks those burned areas across the site. Once a new patch is burned, the previous burn patch begins to recover from intensive grazing. This photo shows a burned patch the year after it was burned. The combination of drought and grazing made it look like a young prairie seeding again because of the abundance of short-lived weedy plants that were able to take advantage of the weakened grasses.
.
A burned patch in June, showing grazing impacts focused mainly on grasses, leaving many forbs ungrazed.
.

Under a light to moderate stocking rate, cattle display their selectivity (choosing to graze grass over forbs) - resulting in a very patchy prairie with short grasses and tall wildflowers.
.

In unburned patches, very little grazing occurs - providing rest for the plant community. This photo was actually taken this week, in a portion of the prairie seeding we fenced out this year to provide complete rest from grazing. We're beginning to include some periods of complete cattle exclusion into our patch-burn systems to ensure that no plant species is grazed every year. This growing season was very wet, so the rested prairie grew very tall - even though it had been grazed fairly hard in 2010.
.

This graph shows the mean floristic quality of the prairie seeding between 2002 and 2011. These data are collected from approximately 100 1m plots each year. Floristic quality is calculated within each 1m plot and averaged across the site. Error bars indicate 95% confidence intervals. Mean floristic quality has remained stable during the entire sampling period.
.

While the mean floristic quality of the prairie has remained stable, the frequency of some individual plant species (% of plots the species occurs in) has varied from year to year. This graph shows frequency (from top to bottom of the legend) of marestail, foxtails, annual brome, black medick, and curly dock - all opportunistic (weedy) species that would be expected to act in just this way.
.

More variability in the frequency of plant species between years. This graph shows (from top to bottom) stiff goldenrod, Canada goldenrod, heath aster, western ragweed, daisy fleabane, and hoary vervain. Interestingly, the species don't seem to track with each other - indicating that each is driven by its own unique set of factors.
.

In contrast to the two earlier graphs, these data show that perennial native grass species have relatively consistent frequencies between years - even though they were subjected to periodic years of severe drought/fire/grazing. From top to bottom, this graph shows data for big bluestem, Canada wildrye, indiangrass, little bluestem, prairie cordgrass, and switchgrass.
.

Similar to the perennial native grasses, many long-lived prairie wildflowers are also maintaining stable frequencies between years. Species that were common in 2002 are still common now, and species that were uncommon remain the same. Though I'm only showing a subset of species in these graphs, I've not seen any plant species disappear from this prairie.
.
Like others who restore prairies, I’m still experimenting with techniques for both establishing and maintaining diverse prairie plant communities. However, data like these help me feel more comfortable that I’m being relatively successful to this point – and I see similar patterns in other seedings we’ve done. I’m also more and more impressed with the toughness of prairies and prairie plants. I tried to include photos that showed the kinds of variable stresses this prairie has endured during its 17 growing seasons. Watching this and other prairies survive what they’ve survived helps keep me from worrying so much about whether the coming year will be dry or wet, or whether we’ve got the right number of cattle in the prairie each year.
As I said earlier, there is still much to learn about how animals (vertebrates and invertebrates) are using our seedings, but that is a separate avenue of exploration. Building resilient plant communities around and between those remnants is the first step to better prairie viability.
So far, so good.


