Visualizing Plant Community Change

Quick announcement: if you’re a graduate student doing research related to conservation in the Great Plains of North America, you should check out the J.E. Weaver Competitive Grant Program. We are offering up to five grants of $1,500 each to graduate students. Read more here.

About a week ago, I posted a bunch of nerdy graphs with data from some of our restored sites at the Platte River Prairies. I’ve been glad to hear from at least some of you that found those interesting. However, graphs showing how species richness or individual species occurrence changes over time are interesting, but they only show parts of the overall story. I’ve been playing with another way to better illustrate the full picture of a plant community’s species composition through time.

Photographs can help illustrate what prairies look like and how they change through time, but they only show the plants that are most visually apparent at the time of the photo. This is a 2009 photo of a restored prairie planted in the year 2000. It is one of the two sites I’m highlighting in today’s post.

What I really want to do is to step back and look at an entire plant community to examine how its composition changes through time. The concept I’m sharing today has been useful to me, but I’d love to hear feedback from others. I’d also like help naming the graphics I’ve constructed. When I started, I called them plant community signatures, but that’s doesn’t feel quite right. Help?

(For those of you who are more interested in pretty pictures than data, I did throw in a few recent photos of ice bubbles at the very end of today’s post, just for fun. If you want to see them, however, you’ll have to scroll past all my cool visual data representations first.)

The data used to create these illustrations are the same data I showed graphs of in my last data post. As a reminder, to collect the data, I plop down a 1x1m plot frame, list the plant species within it, and then repeat that over and over across a site (about 70 or more times per site). I can then calculate frequency of occurrence for each species, which is simply the percentage of those 70 or so samples each species was found in.

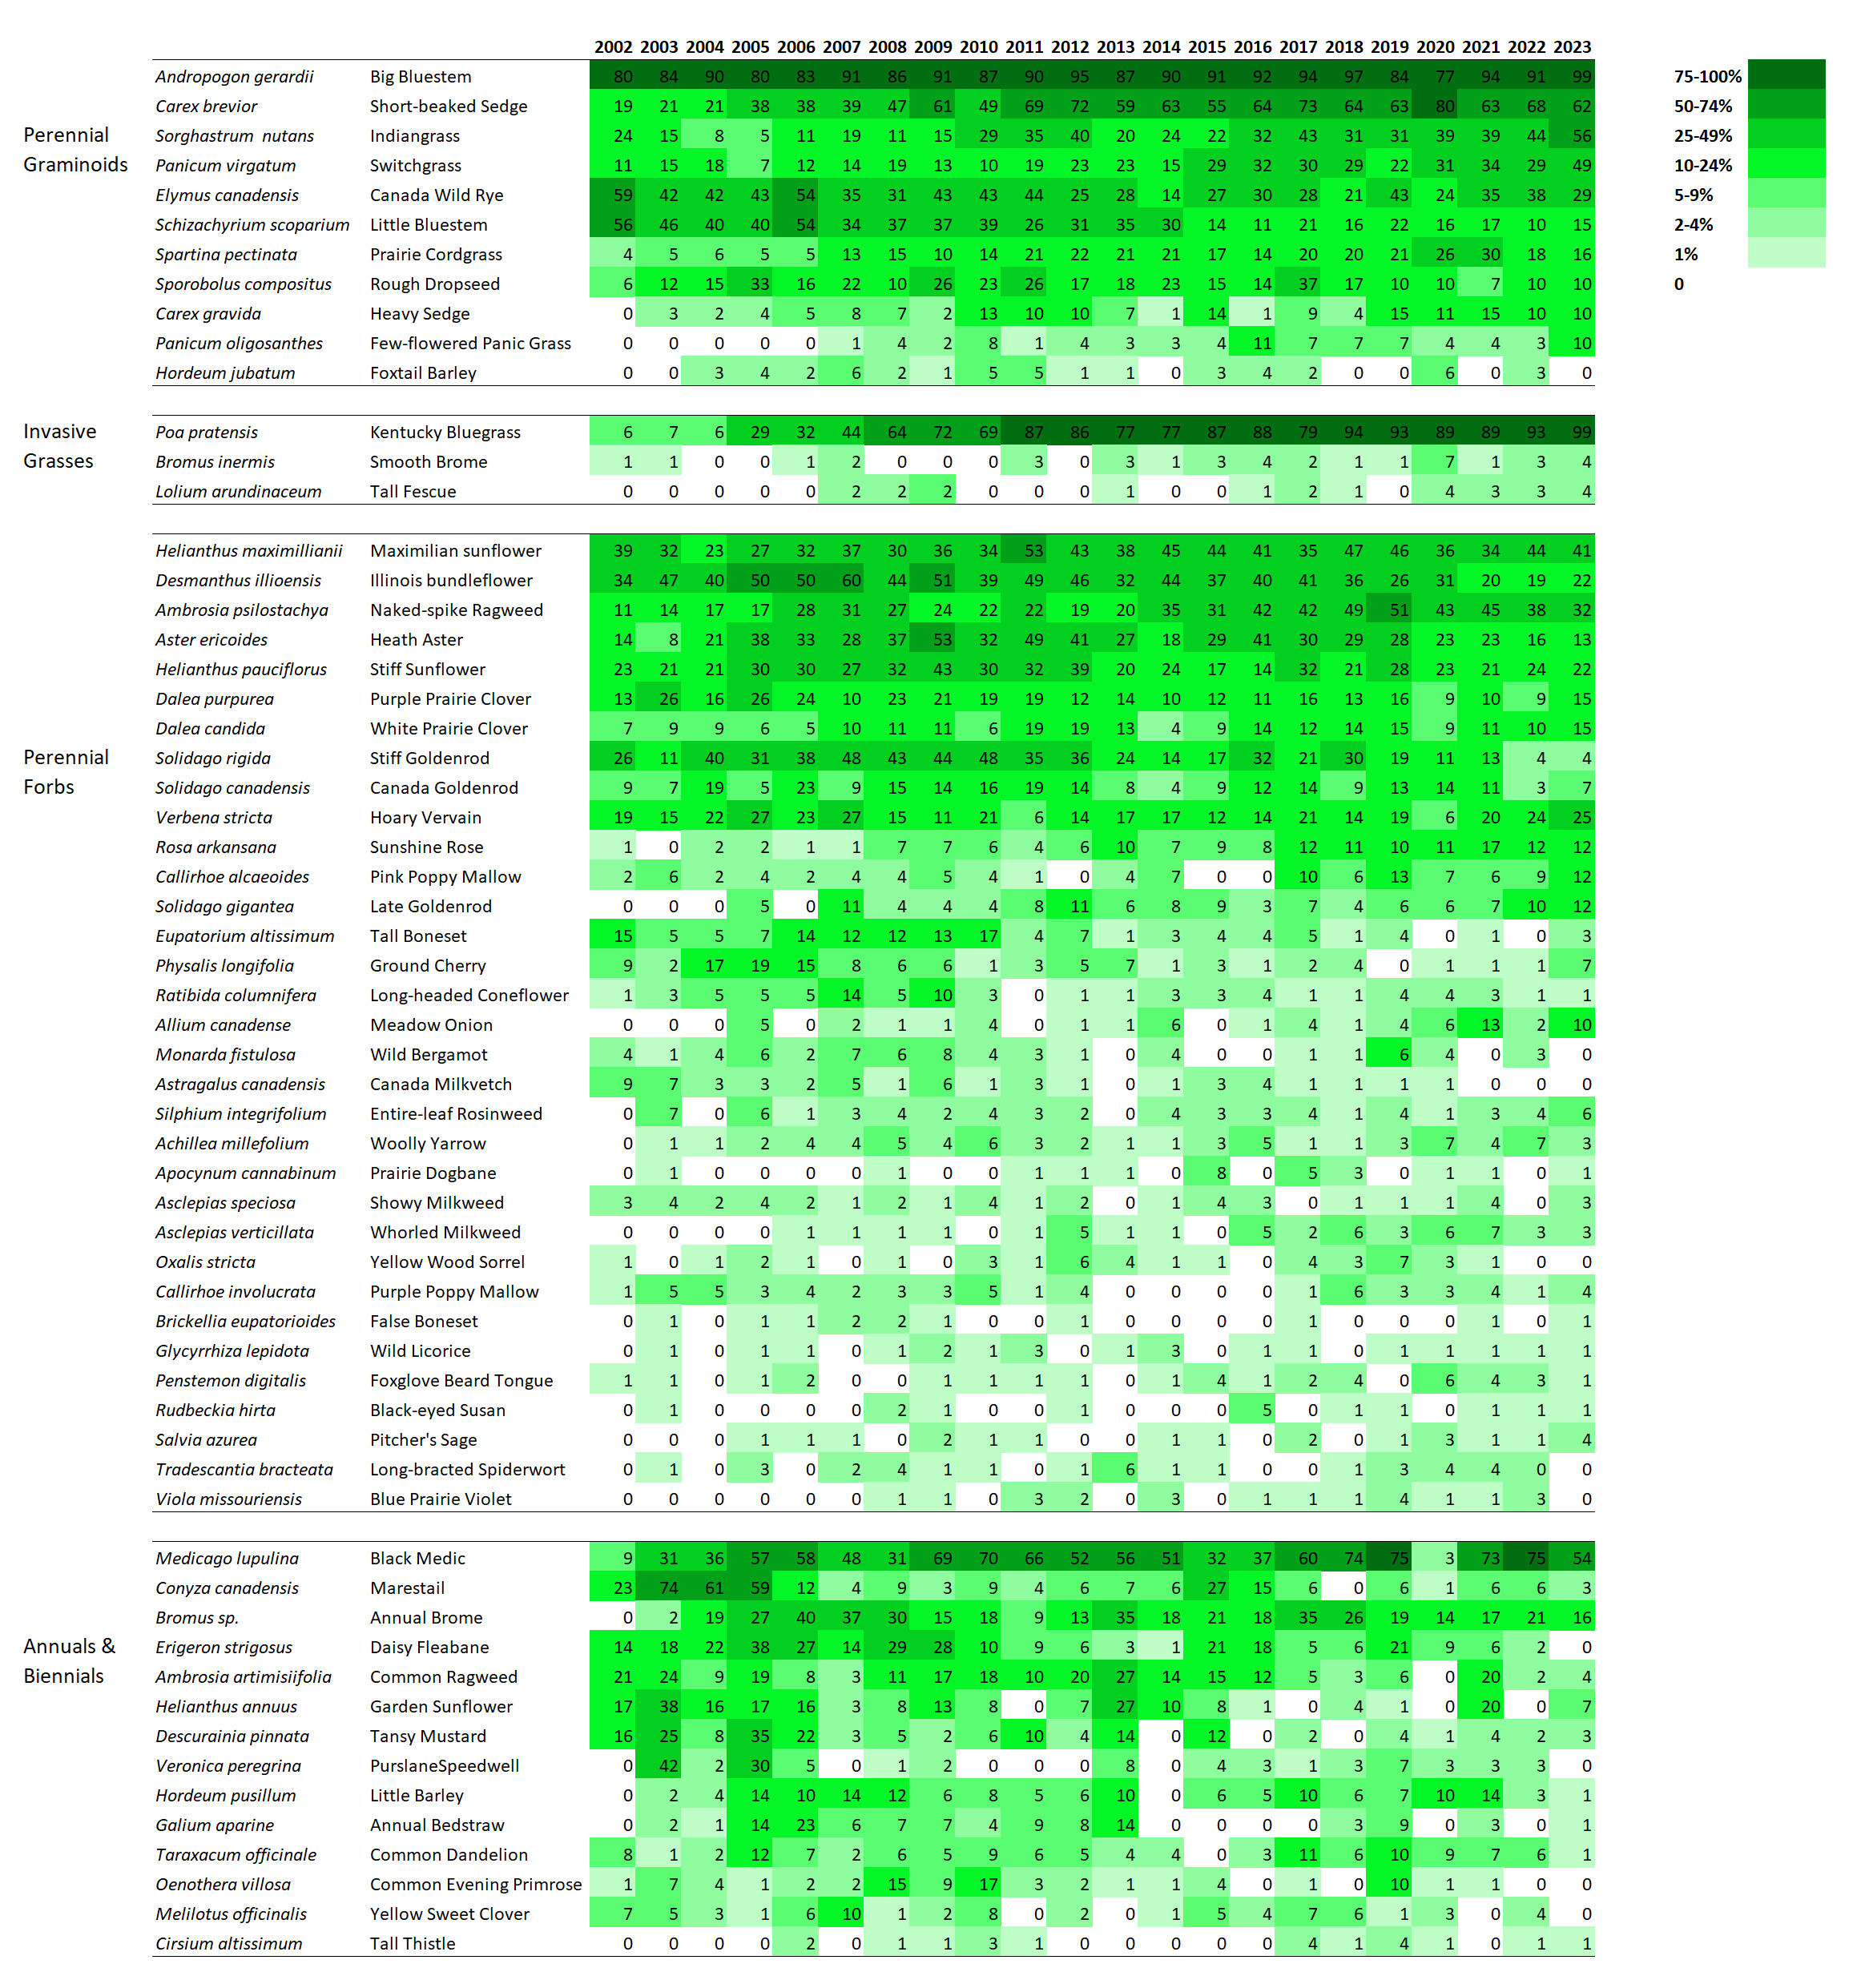
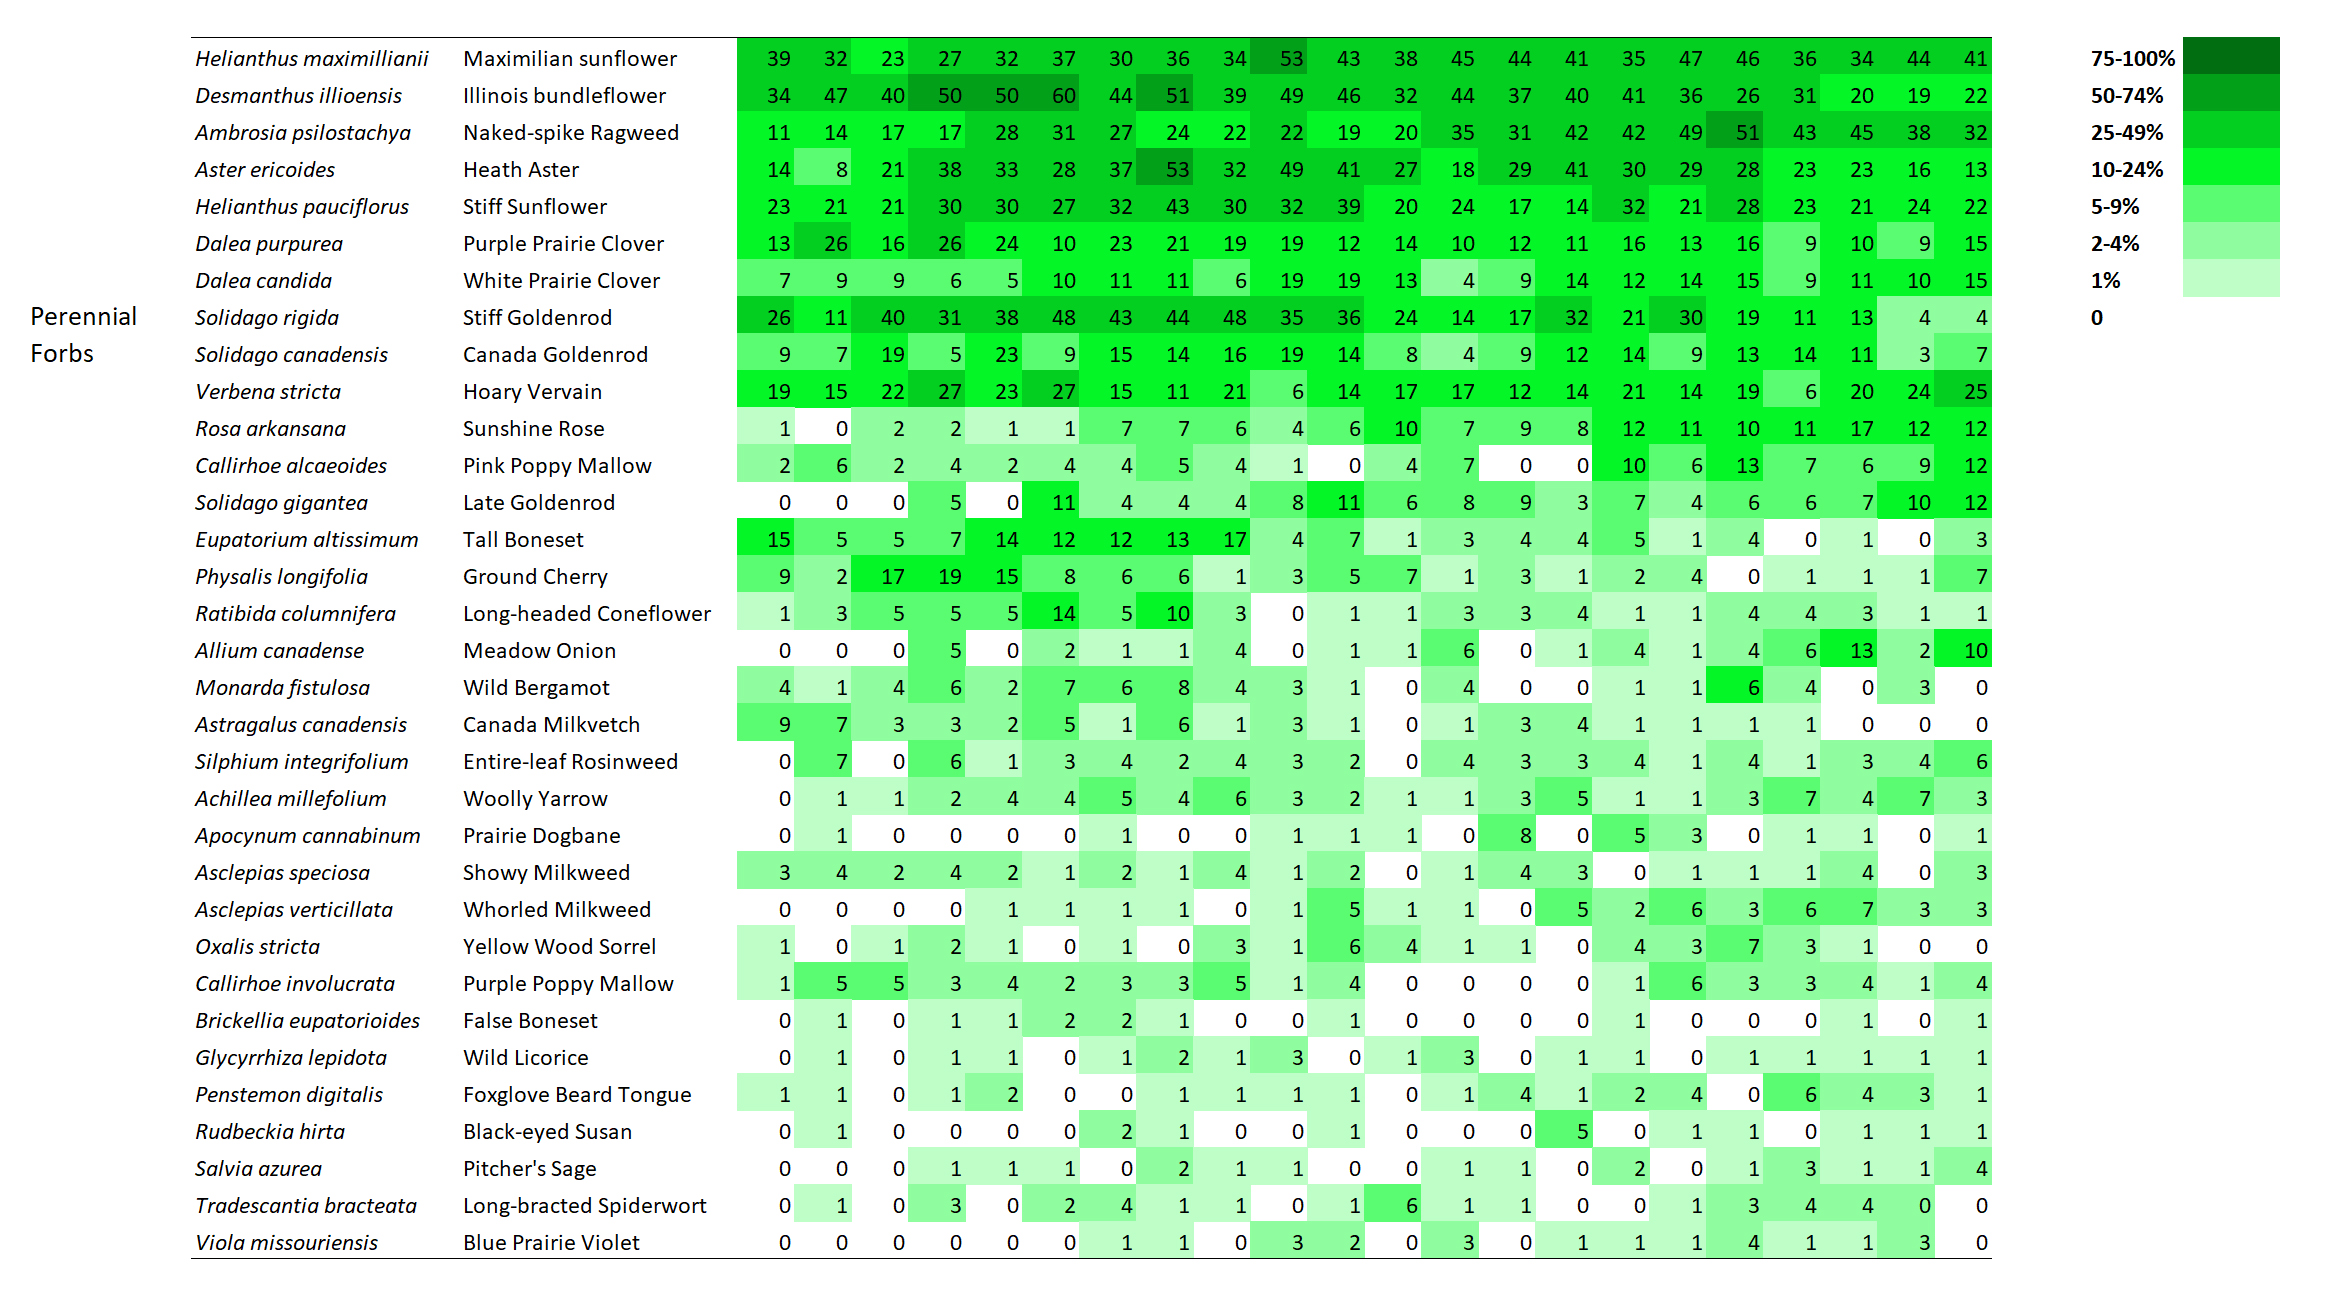
Once I have the data, I lay it out in a spreadsheet format to display the frequency of occurrence changes for each species through time. However, to make it easier to see patterns, I’ve colored each cell so that less frequent occurrence is light green and more frequent occurrence is dark green. I’ve also tried to group species together in a logical way. The result – at least to me – is a fascinating way to step back and study how plant composition varies over time.

I’m displaying results for two sites here. The first is a 1995 planting that I’ve collected data from annually since 2002. The second is a 2000 planting that I’ve collected data from every other year since 2003. I’m not displaying results for every species – just 60 or so of the species in each site that are abundant enough to be captured fairly regularly in 70 1x1m plots. If you want more details on these sites, you can get it from my last data-heavy post.

SITE 1 – Dahms 1995 Prairie Restoration. A 45 acre mesic site on sandy loam soils planted in spring of 1995 with approximately 150 plant species.

Here is the full graphic for the 1995 prairie restoration. It shows the frequency of occurrence between 2002 and 2023 for each featured species.

Remember to click on the title to open this post online if you’re reading it in an email. Doing that will then allow you to click on each image to see a larger, more clear version of it.

When I stare at this graphic, the first thing I notice is that there are very few examples of species that are on a distinct trajectory of increasing or decreasing frequency of occurrence. Most species simply fluctuate up and down through the years – some more dramatically than others. As expected, most of the most variable species are in the ‘annuals and biennials’ category. I think that’s great, and is evidence of ecological resilience.

Now, let’s look more closely at each of the four categories.

This graphic shows perennial grasses and sedges, including three invasive perennial grasses. Two species show a strong trend of increasing abundance. One is a native sedge (Carex brevior) and the other is Kentucky bluegrass.

Looking at the perennial grasses, it’s clear that big bluestem has been a dominant feature of this site for the duration. That’s fine, but not particularly surprising to me. What’s more interesting is the increasing abundance over time of both short-beaked sedge and Kentucky bluegrass. I’m happy about the sedge becoming more common. It’s a cool little plant. Kentucky bluegrass, of course, is less exciting because it has the potential to form monocultures and decrease plant diversity.

However, and this is really important, I’m not seeing any evidence – either here, in my other analyses, or on the ground, that Kentucky bluegrass is having a significant impact on plant diversity. Now, that could certainly change, but at least so far, it seems to be just hanging out (though it’s hanging out in a lot more places than it used to). It’s a great reminder that we should always measure the impact of invasive species, rather than just measuring the extent or abundance of the invaders themselves.

I’ll quickly highlight two other species that intrigue me. Little bluestem has become less common across the site over time, though it seems to have stabilized at about 10-20% occurrence in recent years. Simultaneously, prairie cordgrass has done the opposite, becoming more common.

Little bluestem likes drier habitats and cordgrass likes wetter. Does that mean the site has gotten wetter? I don’t think so. Instead, I think what we’re seeing is a long-term self-sorting process of a planted prairie. When the site was planted, the seed mix included way more little bluestem seed than cordgrass seed. As a result, I think the early establishment of those two species wasn’t representative of their actual adaptation to the site. Over time, I think they’ve both shifted around until they’ve settled into the microsites (and abundances) they’re best suited to.

Frequency of occurrence for perennial forbs in the 1995 planting.

I don’t see much drama happening within the perennial forbs at this site. That’s pretty reassuring, actually, given the kinds of stresses that the prairie has experienced. It’s been managed with patch-burn grazing or open gate grazing since 2002, when this data collection started. As a result, the plant community has been exposed to fire, season-long intensive grazing, and multi-year rest/recovery periods. On top of that, of course, are the wet and dry years that can also significantly affect the growth and survival of plants. It’s good to see that none of these species seems to be disappearing (which also matches up with my other analyses of our restored prairies).

The only species I see that seems to show a significant trend toward lower abundance is tall boneset. That’s not a species known to be particularly sensitive to grazing pressure, as far as I know. In fact, I think of it more as a plant that does well with the kind of lower grass dominance that comes after a bout of grazing.

My best guess is that tall boneset is a species that started out very abundant because of both lots of seed in the mix and a slow, weedy early establishment period for this planting. Over time, it might just be dropping in abundance because it’s not as competitive in this soil type when competition from its neighbors is stronger. I’m just guessing here, though. The point is that the graphic helps me identify this pattern and ask questions!

Short-lived plants and their frequency of occurrence through time.

Within the annual and biennial plants I included, it’s fascinating to see how volatile their frequency of occurrence can be from year to year. I don’t see any species with a decided trend – the species seem to just bounce up and down. What’s most intriguing to me is that all the bouncing doesn’t seem to be synchronized across species. In other words, all these short-lived plants are responding to different stimuli as they increase and decrease in their abundance.

SITE 2 – Dahms 2000 Prairie Restoration. A 69 acre mesic prairie on sandy loam soils planted over the winter between 1999 and 2000.

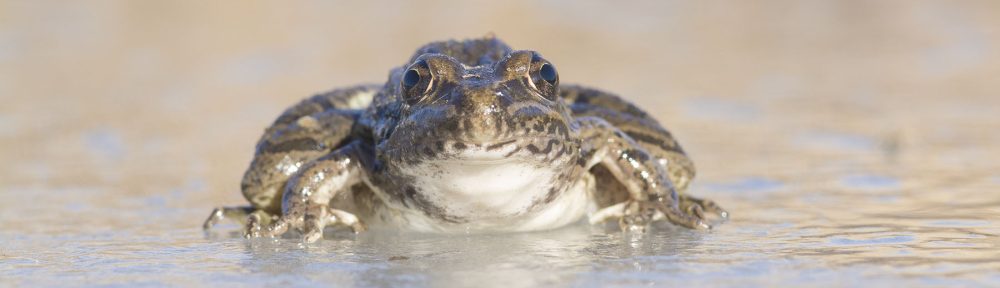
Now, let’s look at the second site (the one shown in the photo at the beginning of this post).

The Dahms 2000 restoration was planted with 202 species, most of which have been found at the site. Here is the full graphic for this planting, showing frequency of occurrence data for about 60 of those plant species.

I’ve only collected data from the Dahms 2000 site every other year, so there are fewer columns. Also, the site was only in its fourth growing season when I started collecting data, so we’re seeing more of the ‘early establishment’ phase of this site than we did of the 1995 planting, which was in its 8th year of growth when I first collected data there.

Frequency of occurrence for perennial grasses and sedges, including two invasive grasses.

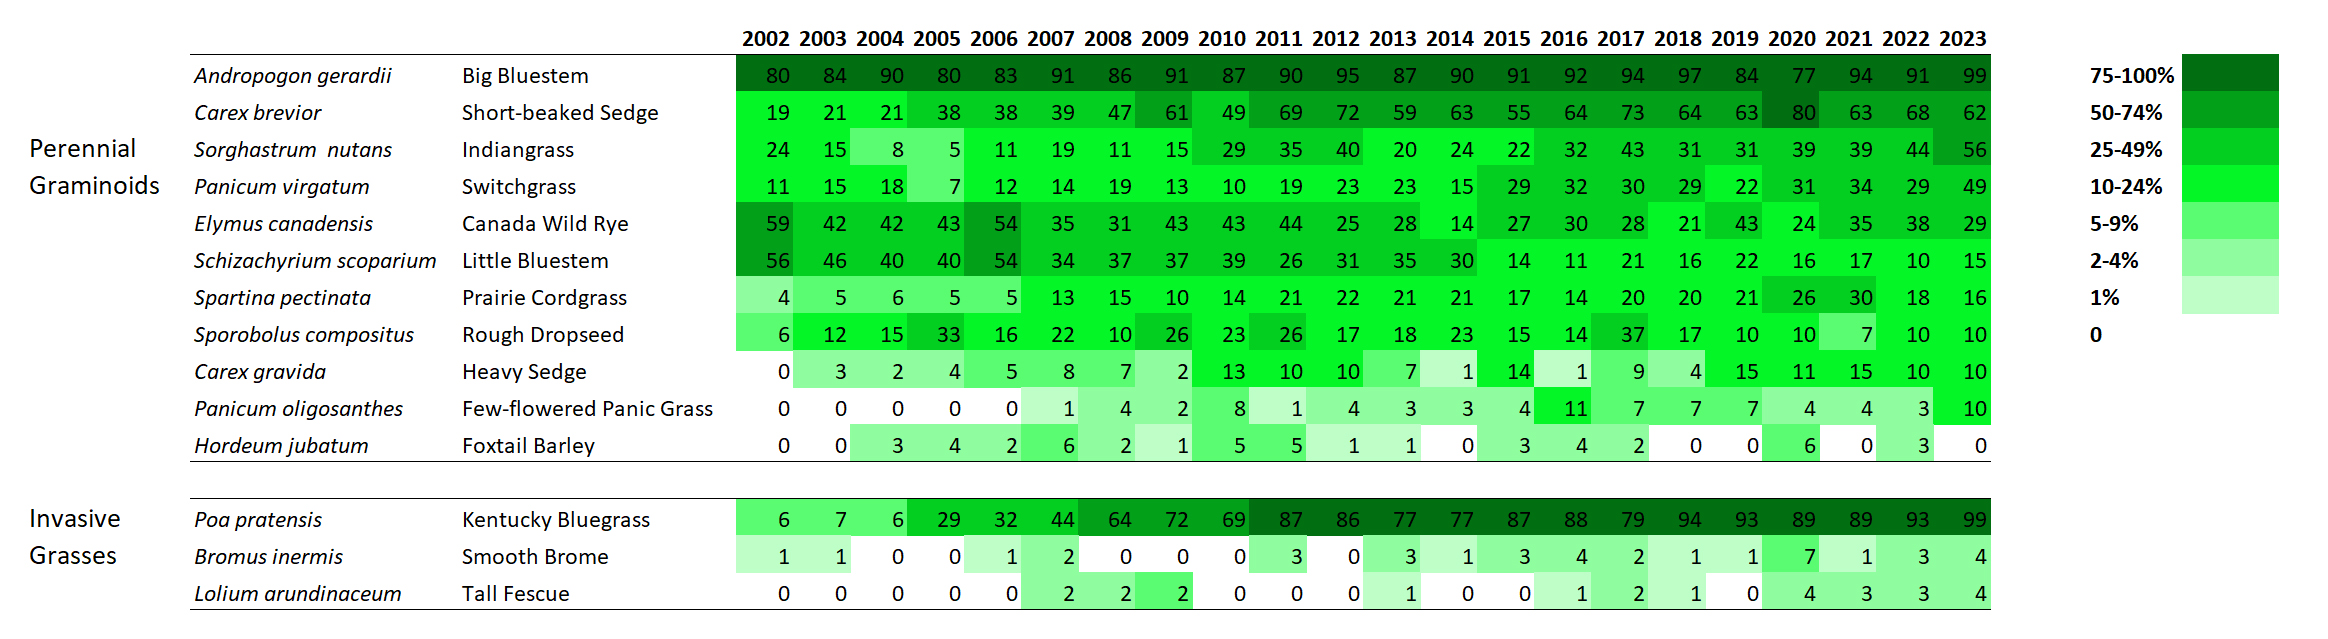
Interestingly, there is a little more directional change within the grasses at this site than in the 1995 planting. Is that because the data includes earlier periods? Maybe, but even so, the change seems to continue past the first 8-10 years for at least some species. Big bluestem, Indiangrass, short-beaked sedge, and switchgrass all seem to be on trends of increasing frequency. Canada wildrye seems to be going in the opposite direction so it’ll be interesting to see if/where it levels off.

Both Kentucky bluegrass and smooth brome have increased in percent frequency over time. However, as in the 1995 planting, I’m not seeing any negative impacts on species diversity (yet?).

Frequency of occurrence of perennial forbs in this 2002 planting.

Within the perennial forbs, a few species at the top (stiff sunflower, yarrow, and bergamot) seem to be on an upward trend, at least before the last sampling period. You might notice that there are a lot of species – across all the categories – that dipped in frequency in 2023. I’m pretty sure that’s a consequence of thatchiness caused by a recent lack of fire and grazing, which was intentional on the part of the Platte River Prairies preserve manager (a combination of a scheduled rest period and a response to a couple dry years). I’m confident the numbers will bounce back up again over the next few years as the site gets more fire and grazing again.

Apart from those species, I think the most interesting thing about the perennial forbs is the lack of many obvious trajectories. For the most part, species seem fairly stable in their abundance through time, though some ebb and flow in interesting ways. Some species that have been labeled ‘aggressive’ in some circumstances don’t seem to be acting that way here, including Canada goldenrod and Maximilian sunflower.

Frequency of occurrence of annual and biennial plants in a 2000 prairie planting.

Just as in the first site, short-lived plants bounce around a lot in their frequency of occurrence. The variation over time is evident even though the data was only collected every two years. Once again, I don’t see much synchrony within those bounces, which tells me each species responds individually to the myriad stresses applied to the site over time. Fascinating!

So, there’s my attempt at a visual display of plant community change in our restored prairies. Does the approach seem helpful? Suggestions for improvement? Ideas for what to name the graphics?

.

And now, for those of you hoping to see pretty pictures, here are three photos of ice bubbles from a restored wetland at the Platte River Prairies last week. Enjoy!

The Joy, Angst, Excitement and Dread of Walking Through a Young Restored Prairie

Anyone who has watched a prairie seeding go through its first several years of establishment will appreciate and identify with this post.  For those of you who haven’t, the best analogy I can come up with is that the experience is a little like watching your son or daughter go off into the world on their own.  You can spend tremendous energy planning ahead, preparing a site, and harvesting and planting seed, but at some point, you have to just stand back and let the new prairie stand or fall on its own.  Sure, you can jump in and knock back the weeds a little now and then, but eventual success or failure depends upon many factors beyond your control, and it can be hard to predict the result during the first few years.

In February and March of 2016, we planted about 60 acres of land with a seed mixture of around 140 prairie and wetland plant species.  The site had been cropland for many years, and then was converted to a mixture of native grasses and used as pasture.  Eventually, the site became heavily invaded with tall fescue, smooth brome, and Kentucky bluegrass.  A few years ago, we decided to kill off the existing vegetation and try to establish a much more diverse plant community.  Although it had been farmed, the site still had some remnant wetland swales that had been farmed through and partially filled, but still had some wetland hydrology.  Restoring this 60 acres feeds into our larger restoration objectives of enlarging and reconnecting remnant (unplowed) prairies in the area.

Volunteers hand broadcast wetland seed on frozen wetlands during February 2016.

This “drop spreader” was used to plant the majority of the site.

We used a combination of herbicide application and tillage to get rid of the grasses and prepare a seed bed.  In addition, (under the appropriate permits) we had a contractor with a big scraper come in and deepen/widen the degraded wetland swales.  Using seed we harvested from nearby prairies and wetlands, a couple different groups of volunteers hand-planted the wetland swales and low sandy ridges created by excavation spoil, and we used a broadcast seeder behind a UTV to plant the remainder of the site.  (Thank you to the U.S. Fish and Wildlife Service, Nebraska Natural Legacy Project, and Nebraska Environmental Trust for funding this project.)

During the 2016 growing season, I visited the site very rarely, and didn’t spend much time there when I did.  Early in the season, there wasn’t much germinating and growing except the kinds of “weeds” you’d see in an abandoned crop field (foxtails, pigweeds, ragweeds, annual sunflowers, etc.).  Later in the season, those weedy plants had grown so tall and thick, it was physically difficult to walk through them.

This photo shows the kind of weed cover that grew during the first growing season. Lots of tall ragweed and annual sunflowers were joined by some perennial sunflowers and other plant species we had seeded.  This is pretty typical of what we see during the first year of our restored prairies.

I walked around this site on Monday of this week and tried to capture what I saw with my camera.  As I explored, I experienced a roller coaster of emotions.  Some areas are looking way ahead of schedule, with a nice diversity of prairie and wetland plants coming in, while others don’t look like they’ve even started, or have problematic plants that we might eventually have to deal with.  On the whole, I feel good about the progress of the restoration, though we do have some trees to control, but my overall confidence comes mainly because I’ve been through this process many times.  We’ve had restored prairies look like junk for 4 or 5 years before finally kicking into gear, and others that look like a prairie after two years.  Very rarely have we seen plantings fail.  Regardless, it’s way too early to guess how this planting will turn out.

For what it’s worth, here is what I saw and thought about during my walk around this prairie at the beginning of its second field season.

The first thing I saw as I walked into the new prairie was a pretty good sized patch of 3-4 foot tall cottonwood trees (Populus deltoides).  The parent trees can be seen in the background.  We’ve been getting smarter about removing those kinds of seed  sources before starting projects, but these trees are growing along a public road and we didn’t have the authority to remove them.  We’ll have to evaluate our options for controlling the young cottonwoods in our new prairie.

A skeleton of an annual sunflower from the initial season shows how big some of those pioneering species were last year. Many of the sunflowers were over 12 feet tall.

Biennial wildflowers, like this prairie ragwort (Packera plattensis) germinated last year and are blooming this year. Hopefully, this one will start a colony that will help support spring-flying bees and other pollinators in future years.  A pair of crane flies are mating on top of this one.

I was excited to see quite a few sedges blooming in only their second year. We don’t always get quick establishment of sedges from seeds. This one (Carex craweii) was in a patch of maybe 10 plants along the edge of a wetland, and I found at least three other species growing elsewhere in the site.

To balance out the excitement of seeing lots of sedges, I also found quite a few areas where there wasn’t much yet growing from our seed. This big patch of marestail (Conyza canadensis) was representative of maybe 30% of the planting. I think this is a soil issue – in our alluvial soils, prairie plant communities can vary dramatically from place to place, based on the soil deposits beneath them. Restored prairies establish with great variation for the same reasons.

Canada milkvetch (Astragalus canadensis), hoary vervain (Verbena stricta), goldenrod (Solidago gigantea), and Canada wild rye (Elymus canadensis) make up a very nice patch of new prairie plants.

The wetland swales are filling in quickly with wetland plants, including lots of spikerushes, grasses, rushes, and a few forbs and sedges. Much of that vegetation came from our seed, but I think some also came from the seedbank.

We purposefully designed the wetlands to vary in their depth to groundwater so that we’d have some areas of standing water most of the time, but also many other areas that go dry each summer.

Some of the wetland pools had tadpoles in them, likely from the Woodhouse’s toads that have already colonized the area. I also saw leopard frogs hopping around.  In addition, numerous snails, and aquatic insects were moving around in the water, and dragonflies and damselflies were buzzing around above it.

This section of wetland had standing water a few weeks ago, but has now gone dry, leaving great habitat for shorebirds (but also for young cottonwoods).  The vegetation along the margin of this wetland is mostly native colonizing plant species such as fleabane (Erigeron annuus), yarrow (Achillea millefolium), and Canada wildrye.

Sweetclover (Melilotus sp) is abundant across much of the new site. Experience shows that sweet clover (though I don’t like it) doesn’t seem to actually affect plant diversity much in our restored prairies, so we’ll just let it go until the site is established well enough to support fire and cattle grazing. At that point, the cattle will keep the sweet clover suppressed because it’s one of their favorite plants to eat.

In addition to areas of strong native plant growth and others dominated still by non-native or “weedy” plants, there were also areas where bare ground was still plentiful. Again, alluvial soils make all of this really interesting because the soils vary greatly from place to place and strongly regulate plant growth.

Last year’s seed pods of Illinois bundleflower (Desmanthus illinoensis) show that this native perennial legume established and bloomed in its first year at the site.

Duck and raccoon tracks joined the tracks of many shorebirds along the edges of the restored wetlands. It’s really encouraging to see how quickly wildlife and insect species colonize these sites, even while the plant community is still young.

I’ll probably return to walk through this site numerous times this season because I can’t help myself.  Apart from working on cottonwood trees and a few musk thistles, however, it’s unlikely that we’ll actually do anything else here, so my visits will be mostly out of curiosity rather than to stimulate management.  As with this trip, I’ll see things on future walks that will encourage me and others that will make me wonder if the planting will end up as a disaster, even though I know it’s too soon to know anything.

Within the next few years, we’ll try to burn the new prairie whenever we can, and when the major grasses start to assert their dominance, we’ll begin grazing the site in ways that support a diversity of plants and animals.  Typically, that grazing begins when the site is between 5 and 8 years old.  In the meantime, there’s really nothing to do but wait.  (But I’ll still peek in now and then anyway.)

I was really glad to see coyote tracks along the edge of the site. The presence of these (relatively) large predators will be key to the long-term success of the ecological community in this restored prairie.

For those of you with technical questions about our restoration methods, we didn’t test our seed for viability, but based on previous experience, our seeding rate for this planting was probably about 2-4 lbs PLS/acre, about 2/3 of which was grasses and 1/3 was forbs, sedges, etc.  We typically broadcast our seed into recently harvested soybean fields, so this planting was a little different, but not that different.  We don’t mow weeds during the first season based on trials that have shown no difference in long-term establishment (sandy soils help keep weed densities low enough to still allow sufficient light to hit the ground, despite what it looks like in the 2016 photo in this post).  We don’t cultipack or harrow seeds in either.  We’re fortunate not to have much trouble with aggressive perennial invasive plants in our early plantings, which makes our weed control pretty easy.  Deciduous trees are the main exception to that, especially cottonwoods (as shown above) and Siberian elms (not too bad at this site).  Later, we see invasion by perennial cool-season invasive grasses, but we suppress those with fire and grazing.