Here are two photos that caught my attention as I was going through timelapse imagery the other day…
In my last post, I showed some timelapse photos from a fenceline at The Nature Conservancy’s Niobrara Valley Preserve in north-central Nebraska. At the time, I promised a good story about the trail that developed on the cattle side (right side) of the fence. As a reminder, the fence in these photos was installed in what had been a cattle pasture, but the left side is now grazed by bison (light stocking rate) and the right side is grazed by cattle (moderate stocking rate). More details on the stocking rates below…
The first photo in which cattle appear in their pasture is this one, taken on June 21 at 6:36 pm.

June 21, 2013. 6:36 pm
Notice the absence of a cattle trail in this first photo. Then look at the photo below, which was taken ONE HOUR LATER.

June 21, 2013. 7:41 pm
Seriously? A trail formed the very first time cattle walked along the fenceline??
I’m not surprised or bothered by the development of the trail, but I’m relatively shocked that it only took one pass by cattle to make it! I would have expected the gradual development of a path over a few weeks. On the other hand there were 110 cows and 110 calves in the pasture. Rich Walters, Niobrara Valley Preserve manager, pointed out that if all those cattle followed the fence line in single file formation, that was 880 hooves stepping on those relatively loose sandy soils. I suppose that would have an immediate impact.
Here’s one more surprise. The cattle were brought into this pasture on June 2. Why did it take until June 21 for them to (apparently) make their way to the north edge to graze and then create a trail? I can’t say for sure that they hadn’t explored this part of the pasture prior to the 21st, but there isn’t any indication of grazing impact in the timelapse photos taken between June 2 and June 21. It may be that the cattle had enough forage further south (and closer to their water tank) that they just never wandered very far, but I would have expected them to have made an exploratory pass around the pasture within the first few days – just to see what they had to work with…
Before I go further, I’m sure some people are already mentally condemning cattle for their trail-making and other faults, but that’s not the point I’m making here. As I wrote in a recent post, I think cattle are very useful as prairie management tools, and are comparable to bison in most respects – though the formation of these narrow trails is certainly one difference between the two animals. Sure, cattle trails can cause problems, especially in chronically overgrazed sites with steep slopes and erodible soils, but the vegetation beneath cattle trails can also recover pretty quickly if given the chance. In the meantime, trails can provide valuable habitat for reptiles and invertebrates looking for a place to warm up in the morning sun, and are used as transportation corridors by many other animals besides cattle.
Oh, and in case you doubted me, the photo below proves that there truly were bison on the left side of the fence in 2013, though their numbers and the relative size of their pasture to the cattle pasture on the right created a very different grazing environment.
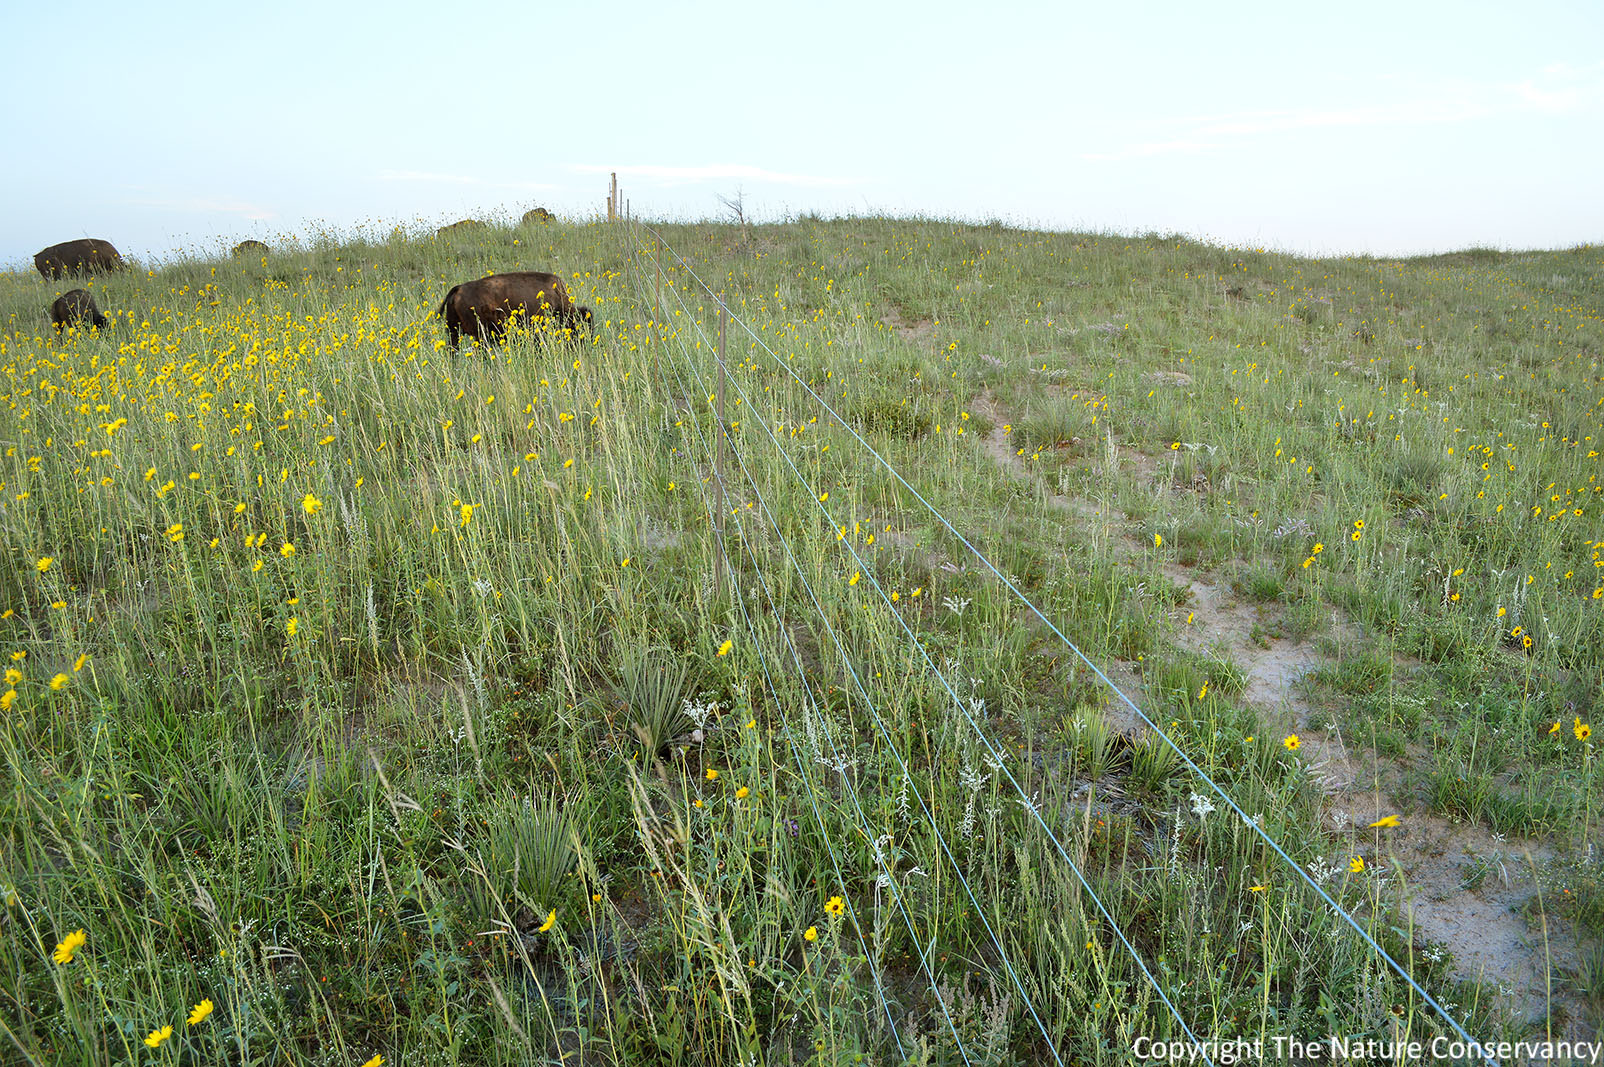
Bison grazing on the left side of the fence. August 10, 2013
The two sides of the fence looked pretty different from each other by the time cattle were removed, in terms of vegetation height and density. After my last post, several of you asked about the stocking rates on each side. There were approximately 225 bison (cows, calves, and bulls) in the 10,000 acre bison pasture to the left of this fence in 2013. They were grazing year round, but had plenty of room to roam since the Preserve staff had cut back their numbers pretty drastically following the big wildfire in 2012. At that stocking rate, bison didn’t graze very intensively in most parts of the pasture, including the area shown in this photo. On the cattle side of the fence, the 110 cow/calf pairs were restricted to only 640 acres of pasture. Even though they were only in the pasture for about 5 weeks (June 2 – July 12), that’s still a much higher effective stocking rate than that in the bison pasture. The difference in the height of vegetation between the left and right sides of the fence, then, is due to stocking rate, not grazer species.
I’m already learning an awful lot from looking at the first year of timelapse imagery at the Niobrara Valley Preserve, and much of what I’m learning has been unexpected. The rapid formation of a cattle trail is a great example. I’ll be sharing another example within the next week or two, though it’s more of a mystery than a lesson at this point. For now, I’ll just tease that post by saying it has to do with a stick that moves by itself… You can have fun thinking about that for a while!